
Collimating lenses are curved optical lenses that make parallel the light rays that enter your spectrometer setup. These lenses allow users to control the field of view, collection efficiency and spatial resolution of their setups, and to configure illumination and collection angles for sampling.
(more…)-
Raman Spectroscopy for Reaction Advancement Monitoring
IMPORTANT: PLEASE REFRESH YOUR BROWSER IF YOU DO NOT SEE ANY IMAGES/SCREENSHOTS ON THE PAGE.
Note: The author of this application note is Amy J. Ray Bauer, Ph.D., Principal Applications Scientist.
Epoxy is a general term referring to epoxy resins, both the individual components and the cured results. Epoxy resins are a family of reactive polymer precursors and polymers that include epoxide groups. These resins are used in an extensive array of consumer and engineering applications because of their durability, strong adhesion, chemical resistance, and other specialized properties.
Epoxy resins are used in the manufacture of adhesives, plastics, paints, coatings, primers and sealers, flooring and other products and materials that are used in building and construction applications. Most materials known as “structural” or “engineering” adhesives are epoxies. These high-performance adhesives are used to make laminated woods for decks, walls, roofing and other building applications, as well as in other products that require strong bonds to a variety of substrates including concrete and wood. Epoxies can stick to metal, glass, stone, wood and some plastics, and are more heat- and chemical-resistant than most glues.
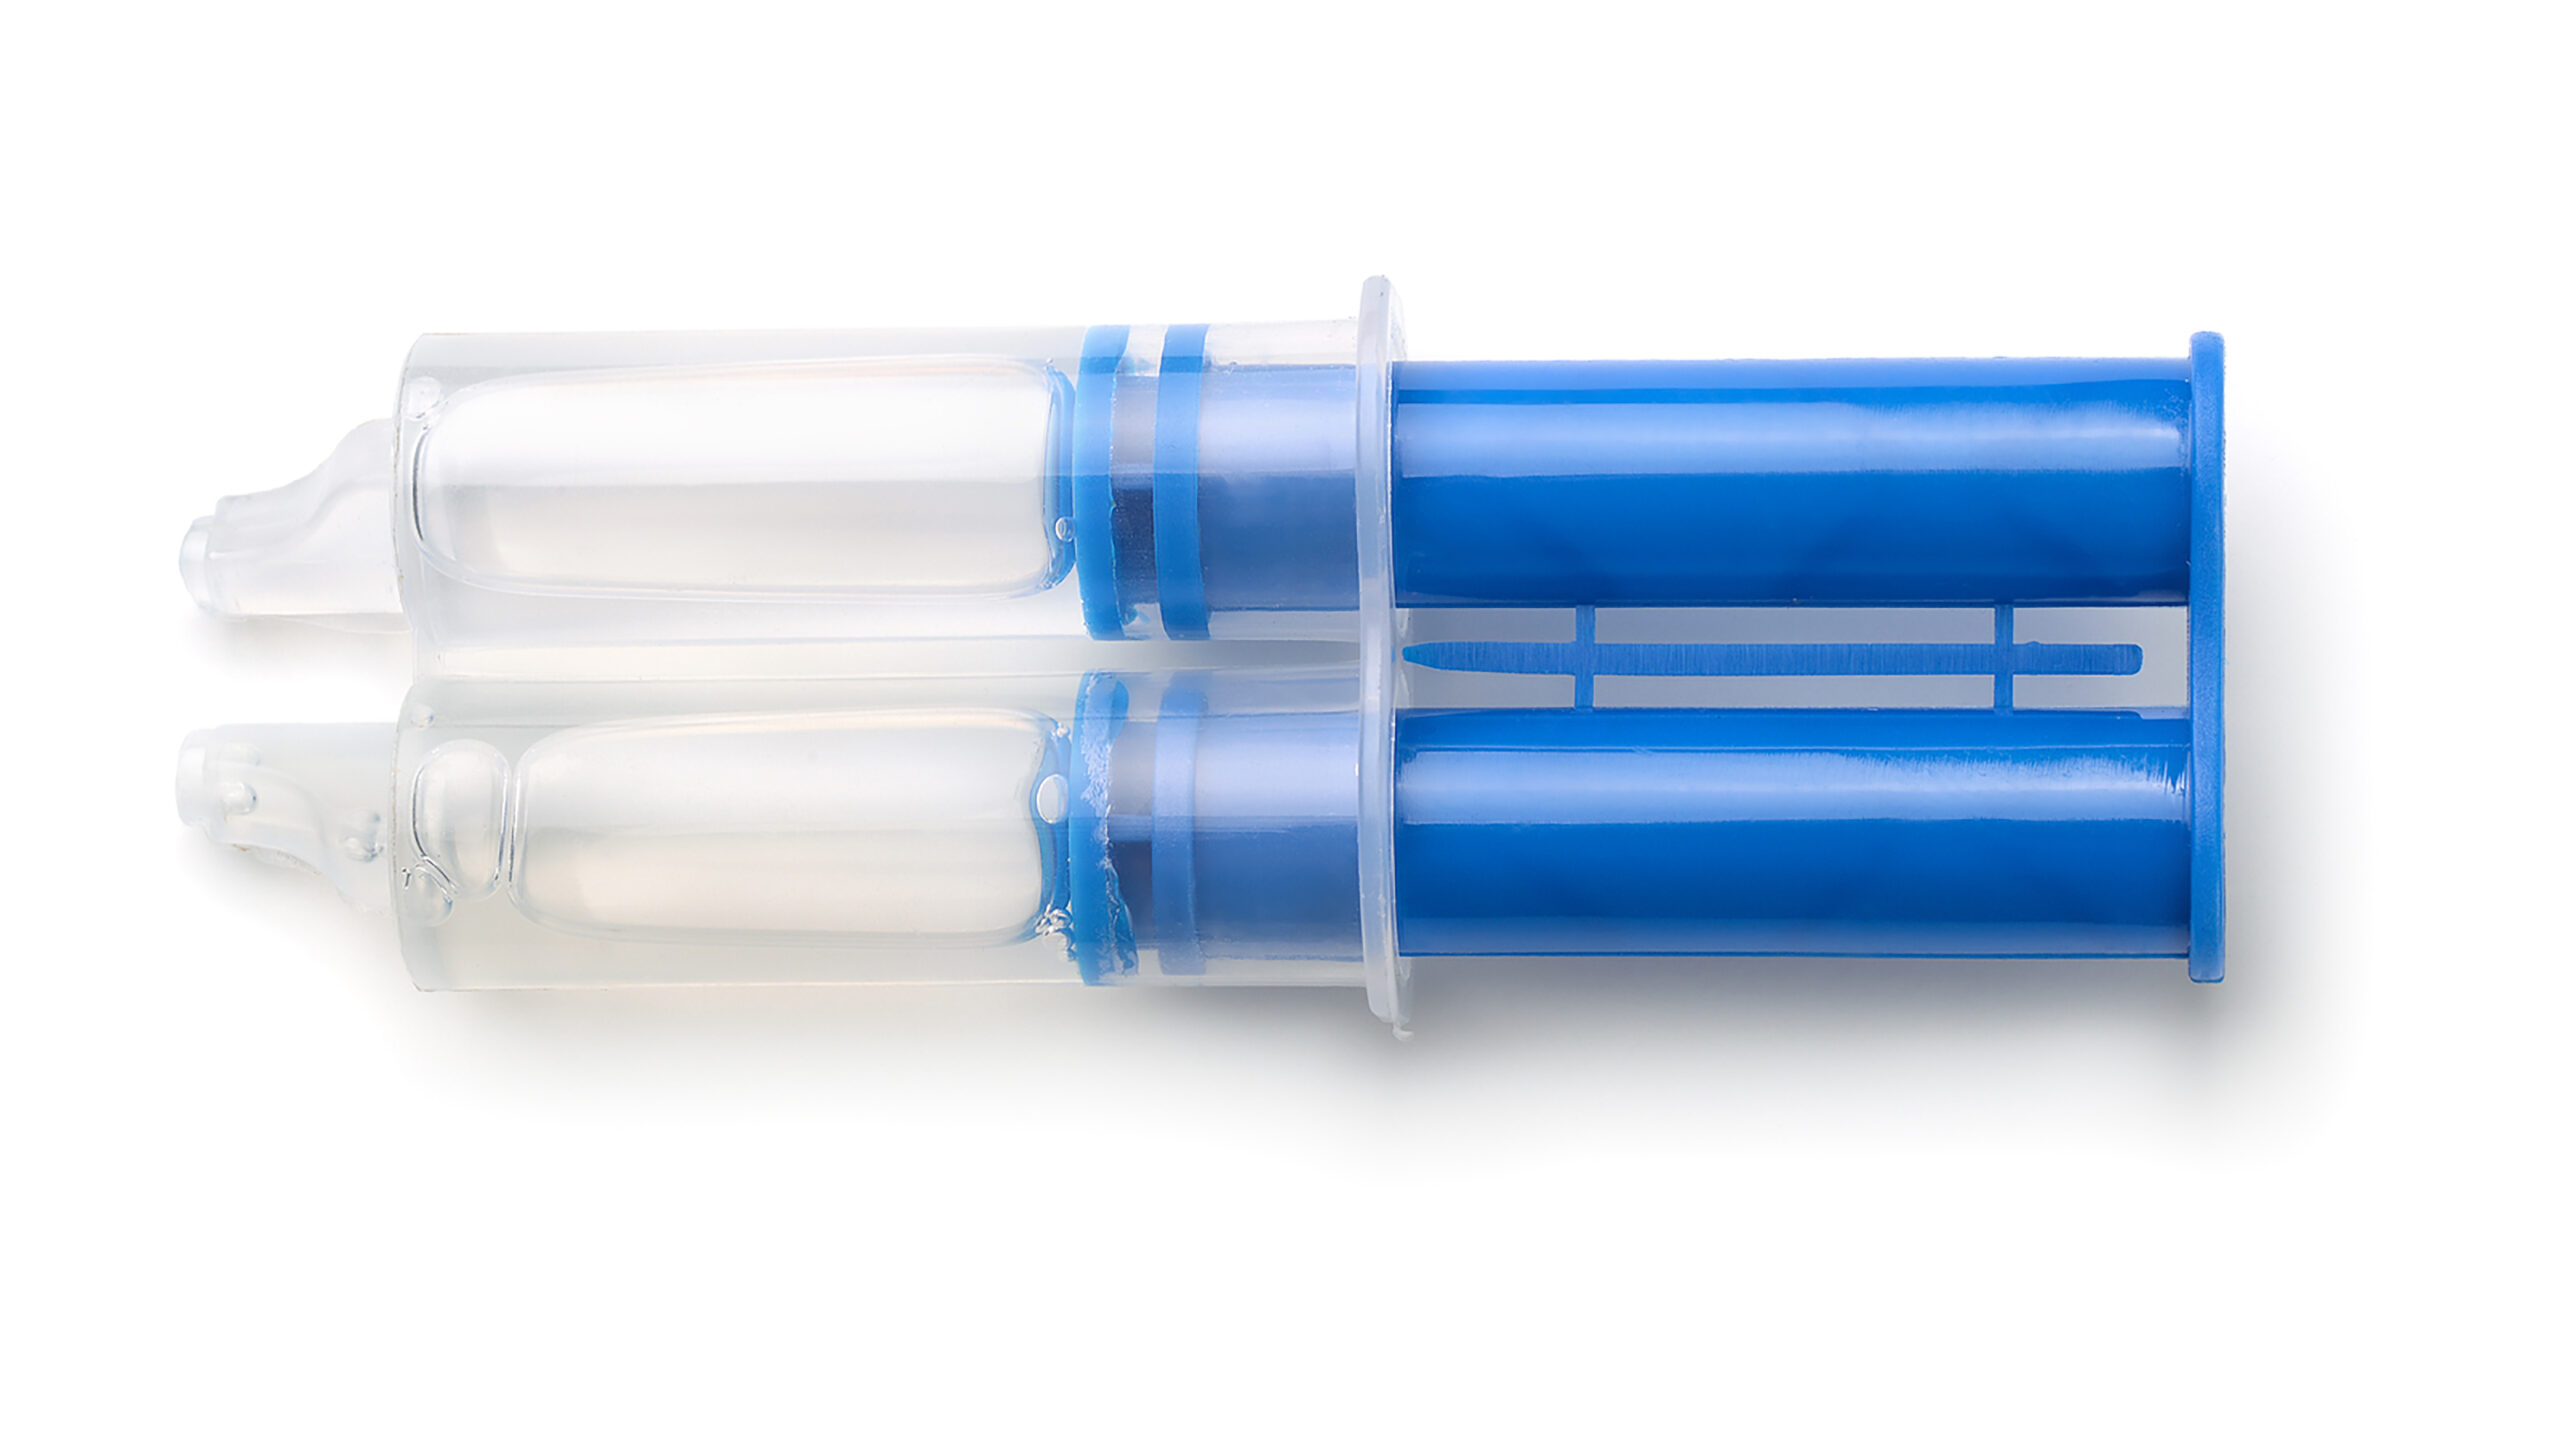
However, all these properties are contingent on proper proportions and mixing. In this application note, we use a readily available two-part epoxy as a model system for monitoring the kinetics and reaction completion of industrial processes, generally, and adhesive curing, specifically.
Experimental Setup
The two-part epoxy used in this demonstration, Devcon® 15 Minute Epoxy, is composed of bisphenol A diglycidyl ether resin and a polymercaptan/polyamine mixture (2,4,6-tri-(dimethylaminomethyl)-phenol and mercaptan amine blend). Mercaptan is an organo-sulfur compound that donates a thiol group to the curing process. Thiols react readily with the epoxide group and are typically used where heat cures are not possible, or a fast cure is needed.
To monitor the curing process, we used an Ocean Insight QE Pro-Raman+ with a 300 mW, 785 nm laser (LASER-785-LAB-ADJ-FC) and a Raman probe (RIP-RPB-785-FC-SMA) suspended at a fixed distance over the curing epoxy. Ambient light was excluded from the laser-sample interaction region with a black cloth. Raman signals were acquired with 3 s acquisition time and 10x averaging. Signals were acquired on the epoxy samples immediately upon mixing and then in 2-3 minute intervals after that. In some cases, signals were acquired the following day, but in no instance did these signals vary appreciably from those collected at 40-45 minutes after mixing.
Measurements
Two samples of different proportions of resin and hardener were mixed, at the recommended ratio of 1:1 and at a 2:1 hardener-to-resin mixture. Following the mixing of the two components, the curing process was monitored with Raman spectroscopy. The analytical focus was principally on the epoxide and thiol features, which diminish upon curing.
Raman bands corresponding to epoxide vibrational frequencies have been reported previously [1], with 1254 cm-1 assigned to be the breathing mode of the epoxide ring (Figure 1). The intensity of this peak is linearly dependent on the concentration of epoxide groups in the resin mixture [1 and references therein]. The peak at 921 cm-1 is likely the epoxide ring deformation and is much weaker. The Raman peaks at 1114 cm-1, 1186 cm-1 and 1610 cm-1 have been assigned to resin backbone vibrations and do not change in intensity during the curing reaction.
The change of the 1254 cm-1 feature with time can be interpreted as the consumption of the free epoxide groups during the vitrification of the epoxy. The reduction of the intensity of the Raman feature at 2575 cm-1 shows the consumption of the thiol in the hardener as the material reacts. The rate of the initial loss of the S-H feature appears to be a function of the initial concentration of the hardener.
The S-H stretch, related to the presence of thiol, is readily observed at 2575 cm-1. In the case of the measurement of 1:1 hardener-to-resin, the S-H feature is still present when the curing process stops. Note that this sample was still slightly sticky to the touch the next day, far after the 15 minute cure time assured on the package. This result could be due to either the incorrect proportions of the two substances or perhaps inadequate mixing of the two.
In the 2:1 hardener-to-resin sample, the initial peak of the thiol feature is slightly higher than in the 1:1 case (Figure 2). This was not evaluated for quantitative behavior, but the ratios of peak heights seem reasonable given that in the 2:1 case, the hardener accounts for 67% of the total material present (two-thirds) and in the 1:1 case, only 50% (one-half). In this second case, there is not enough resin to react stoichiometrically with the available resin, and there is an appreciable amount of thiol remaining in the product epoxy. It is not surprising that the epoxy did not cure well in this case, either.
The S-H feature (analyzed using peak area from 2487-2639 cm-1) in the case of the 2:1 mix comprises about 1.36x more integrated area than that associated with the 1:1 mix. This agrees with the fact that in the 1:1 mix, there is 50% hardener. In the 2:1, there is 67% hardener (a 1.34x increase).
The 2:1 mixture has an appreciable amount of S-H remaining; 1:1 has less S-H remaining at the end of the cure.

Figure 1. Devcon® 15 Minute Epoxy (1:1 resin to hardener), as a function of cure times (minutes).

Figure 2. Devcon® 15 Minute Epoxy (1:2 resin to hardener), as a function of cure times (minutes).
Kinetics Analysis
A kinetic analysis of the S-H loss is readily performed on the data produced with the Ocean Insight Raman system.
Behavior as a function of time of the S-H feature is shown in Figure 3. A visual comparison of the two data traces (markers) shows that first, there is more S-H at the beginning of the process in the case of the 2:1 hardener-to-resin mix than in the 1:1 case.
Additionally, the data markers show that onset of the reaction is slightly accelerated when excess hardener is present. Fitting the data in the region where S-H reactivity is the fastest (excluding the first three points in the 1:1 case) to a simple exponential with an offset (eq. 1), it is apparent that the kinetics of the bulk of the reaction are the same in both mixtures with τ (1/e half-life) of 4.5 minutes. Finally, it is also clear from the tail of both sets of data (markers) that more unreacted S-H remains in the case where more hardener has been added, which is reasonable because the hardener is the source of the thiol.
Equation 1. y = y0 + A * exp [-(x-x0)]/τ

Figure 3. Integrated areas under the S-H feature in both the described cases; also, the exponential fits to the data.
Summary
This brief application note details the use of Raman spectroscopy to elucidate details of the epoxy curing process in real time. This utility can be extended easily to other types of reactive processes, even those that are faster than this relatively slow epoxy vitrification. Ocean Insight supports a line of Raman spectrometers and lasers that are ideal to perform this type of analysis, and the applications expertise to help you solve similar problems.

1. Křesálek, V. and H. Vašková, “Raman spectroscopy of epoxy resin crosslinking,” Recent Researches in Automatic Control, Conference Paper, May 2011.
-
Soil Characterization Using the NIRQuest+ Spectrometer

In this post, we share spectra of various soil samples as measured with the NIRQuest+ spectrometer (900-2500 nm). NIRQuest+ is distinguished by its high sensitivity and great thermal stability.
(more…) -
Spectroscopy of Christmas Lights

In this application note, we use a high-speed Ocean FX spectrometer to measure flicker, color and other spectral characteristics of incandescent and LED holiday lights.
(more…) -
Spectroscopy for Viral Detection

In this overview, we explore the optical sensing tools and techniques available from Ocean Optics for virus detection. Our focus? Rapid testing and screening for viruses including COVID-19.
No matter what type of fight is being fought, one of the first items to assess is the arsenal of tools at one’s disposal. Thanks to COVID-19, 2020 has placed us all in a unique fight, not against a physical army or intangible idea, but against a novel virus that attacks people of all nations, especially our most vulnerable citizens. But we have multiple avenues to fight back, including:
- Distancing. By minimizing person-to-person interaction, we also minimize potential transmissions.
- Vaccines. With a well-designed vaccine, even if someone is exposed to the virus their chances of it turning into a notable infection can be greatly reduced.
- Treatments. If someone is exposed to the virus and it does indeed turn into an infection, an effective menu of treatments can help minimize mortality rates and overall severity.
- Detection and tracing. These are our eyes in the battle against an invisible foe, and the key tools we’ll examine here.
Virus Detection and Tracing
Detection and tracing are critical in understanding how virus spread occurs historically so that future spreading can be minimized. This allows us to consider what activities and scenarios carry the greatest risk, and who among us may be most vulnerable. We can calibrate our policies and actions when we know how and where transmission is occurring.
But while slow detection methods can serve this purpose to a reasonable extent, fast detection techniques bring us even closer to the return to normal routines. A rapid testing system deployed at the entrance of a stadium, school, airport, or nursing home could instantly prevent a super-spreader scenario that we hear about all too often.
Familiar and Newer Viral Detection Techniques
The tried-and-true method of viral detection leans on the revolutionary PCR, or polymerase chain reaction, technology. This approach uses polymerase enzymes to replicate or amplify a specific region of genetic material, if it is present. Templates can be designed that specifically target parts of the COVID-19 genetic code; if those code segments are present, they will be amplified. This amplification requires thermal cycling for roughly 30-40 cycles, which is typically the most time-consuming part of the PCR technique.
Once thermal cycling is complete there are several methods to observe if the targeted genetic material is present. This is where the power of applied spectral knowledge first shows up as a hero in COVID-19 detection.
Common fluorophores such as fluorescein and its derivatives can be further complexed so they become fluorescent only when bound to the targeted COVID-19 genetic segment. With these unique fluorescent tools in hand, the next hurdle we face in decreasing test time and increasing test sensitivity is optimizing that fluorescence detection.
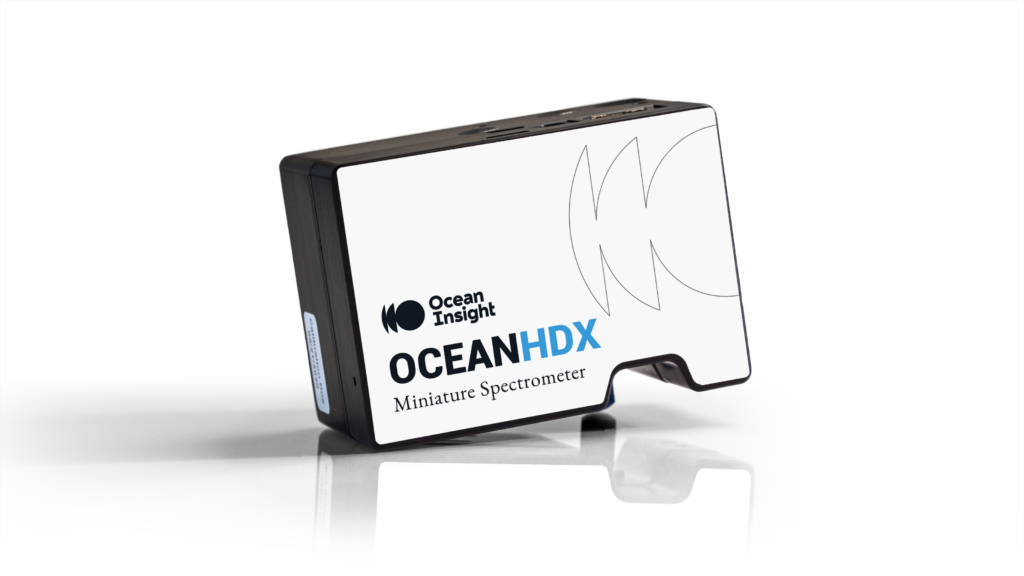
The most common approach for this type of trace-level fluorescence is steady-state broadband spectroscopy, which is well-served by the Ocean HDX spectrometer and LSM LED kits. The Ocean HDX sets a new bar for low-light performance in an amazingly compact spectrometer form factor. Proprietary internal baffling and other optical design triumphs allow fluorescence detection at levels previously only attainable on much larger and more costly systems. Driving that trace fluorescence is one of Ocean Insight’s LSM LED options, providing high-power and stable excitations for clean and coherent emission signals.
The traditional broadband approach brings with it a range of advantages, including the ability to observe multiple fluorescent species at the same time with one device, and the ability to develop intricate numerical methods to deconvolute desired signals from the broadband trends.
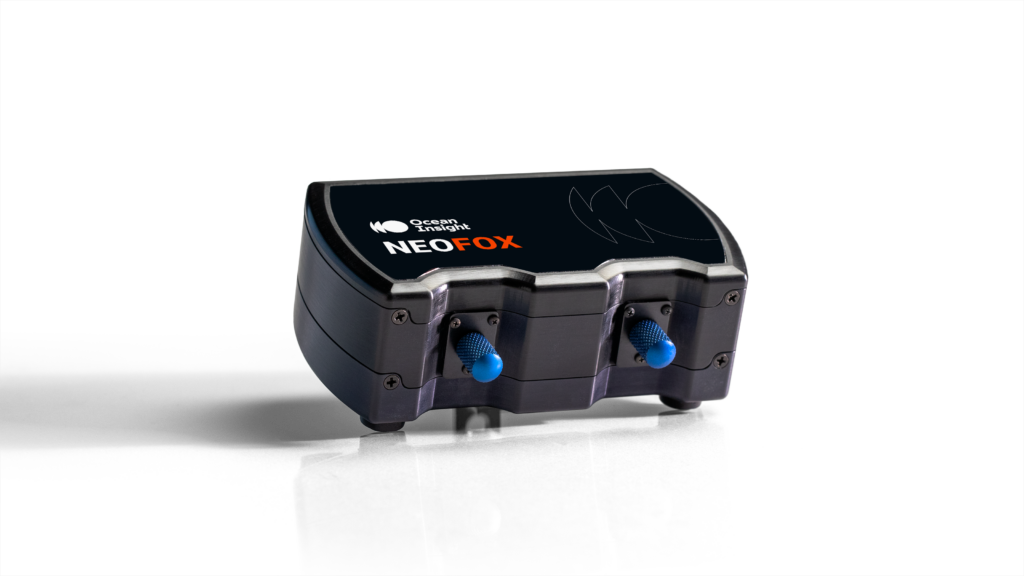
But there is another way to observe this fluorescence signal, by using an approach that exploits the fast decay properties of fluorescent dyes in a time-resolved manner. Ocean Insight typically provides the NeoFox phase fluorimetry system as an optical oxygen sensor platform, since we also develop the oxygen-responsive sensor chemistries and supporting probe and patch components that comprise the sensor platform.
But the NeoFox is also popular for embedding into other devices, with modifications possible to LEDs, filters, and internal settings to optimize the system into a customized detection platform. By strobing the LED as a square wave at kHz speeds, the NeoFox ultra-sensitive avalanche photodiode detector sees the fluorescence signal grow during LED on-time but also decay during LED off-time. This decay time is observed on the microsecond-to-nanosecond scale and can be tightly correlated to the concentration of fluorophore in the test fluid, such as a small PCR sample. Benefits of this approach include simplified hardware, since the NeoFox contains all its optics and processing electronics in a single casing, and provides good interference immunity to variables like sample color and ambient light.
Raman and Trace Level Detection
While PCR has done wonders in the world of genetic advancement, there are still the time constraints related to the necessary thermal cycling. Ocean Insight provides yet another approach with the potential to offer immediate viral detection — with answers in just seconds — without any complex sample pre-processing. This approach exploits the Raman technique, which uses a laser to drive observable Raman scattering phenomena.
Raman is a fast, powerful identification technique based on the rare interaction of photons with the molecular structure of the sample, specifically looking at the increase or decrease in photon energy level at quantized amounts. These sharp emission signals are inherent ‘fingerprints’ for an analyte and can quickly tell you when a certain species is present. Ocean Insight has offered high-performance Raman systems for over a decade at multiple wavelength options, such as the highly popular QE Pro Raman+ platform offered in 785 nm, 638 nm and 532 nm configurations. Adding the wavelength-appropriate laser and probe is all you need for basic Raman measurements.
For trace level detection, Raman emissions can be further amplified by utilizing certain metals that are ‘in-tune’ with the laser frequency being used, leaning on an effect called SPR, or Surface Plasmon Resonance. By using nanoparticles or nanostructures of a metal such as gold or silver, analytes may come in proper proximity to this SPR effect and lead to a dramatic amplification of Raman emission photons, which is a technique called SERS, or Surface Enhanced Raman Spectroscopy. Ocean Insight has been a leading commercial SERS provider since 2014 and offers low-cost, consumable substrates in an easy-to-use form factor. These convenient 5-packs have a proprietary nanoparticle formulation embedded into a quartz matrix and mounted onto a standard glass microscope slide. The user can simply add a few microliters of sample to the nanoparticle-doped region and place it under the Raman probe for rapid detection of trace-level analytes.
Ocean Insight has worked with several developers including Botanisol Analytics using Raman for rapid COVID-19 detection, and even the preliminary scans with off-the-shelf components have shown repeatable Raman activities for both direct viral fragments and the respective antibodies. While these measurements were done in rather clean sample fluids versus patient-obtained clinical samples, the research establishes the regions of Raman activity to look for when checking a “dirtier” real-world fluid. When analyzed using Ocean Intelligence, the advanced spectral machine learning platform from Ocean Insight, scans of complex bio-fluids can be thoroughly and rapidly deconvoluted to provide a positive/negative result with high statistical confidence.
As with any development, your progress is only as good as the partners you find and the resources you make available. Ocean Insight brings a unique level of expertise in spectral hardware, the proper techniques to use with that hardware, and the insight to achieve what has not been done before. If you’re in the fight to dramatically advance viral detection to help the world subdue the COVID-19 pandemic, we are eager to learn about your vision and how our applied spectral knowledge can help you unlock the possible.
- Distancing. By minimizing person-to-person interaction, we also minimize potential transmissions.
-
Tech Tip: Four Simple Steps When Measuring Absorbance
In this tech tip, we describe how careful adherence to just a few basic procedures can help to ensure reliable absorbance measurements.
Absorbance is used as a qualitative tool to identify substances or a quantitative tool to measure the concentration of a molecule in solution. With modular spectroscopy, users choose the wavelength range and resolution best suited for their measurements, and can move between setups for the lab or field. Preconfigured absorbance measurement packages are also available.
Making Measurements
Once you’ve selected your absorbance setup, follow these four procedures to ensure best results:
- Optimize your spectrometer settings.
Set spectrometer integration time so the maximum raw signal is ~80% of full scale, and use the highest number of spectral averages tolerable. Keep boxcar width to about the same value as the pixel resolution of the spectrometer, otherwise you can affect spectral resolution. - Ensure an accurate reference measurement.
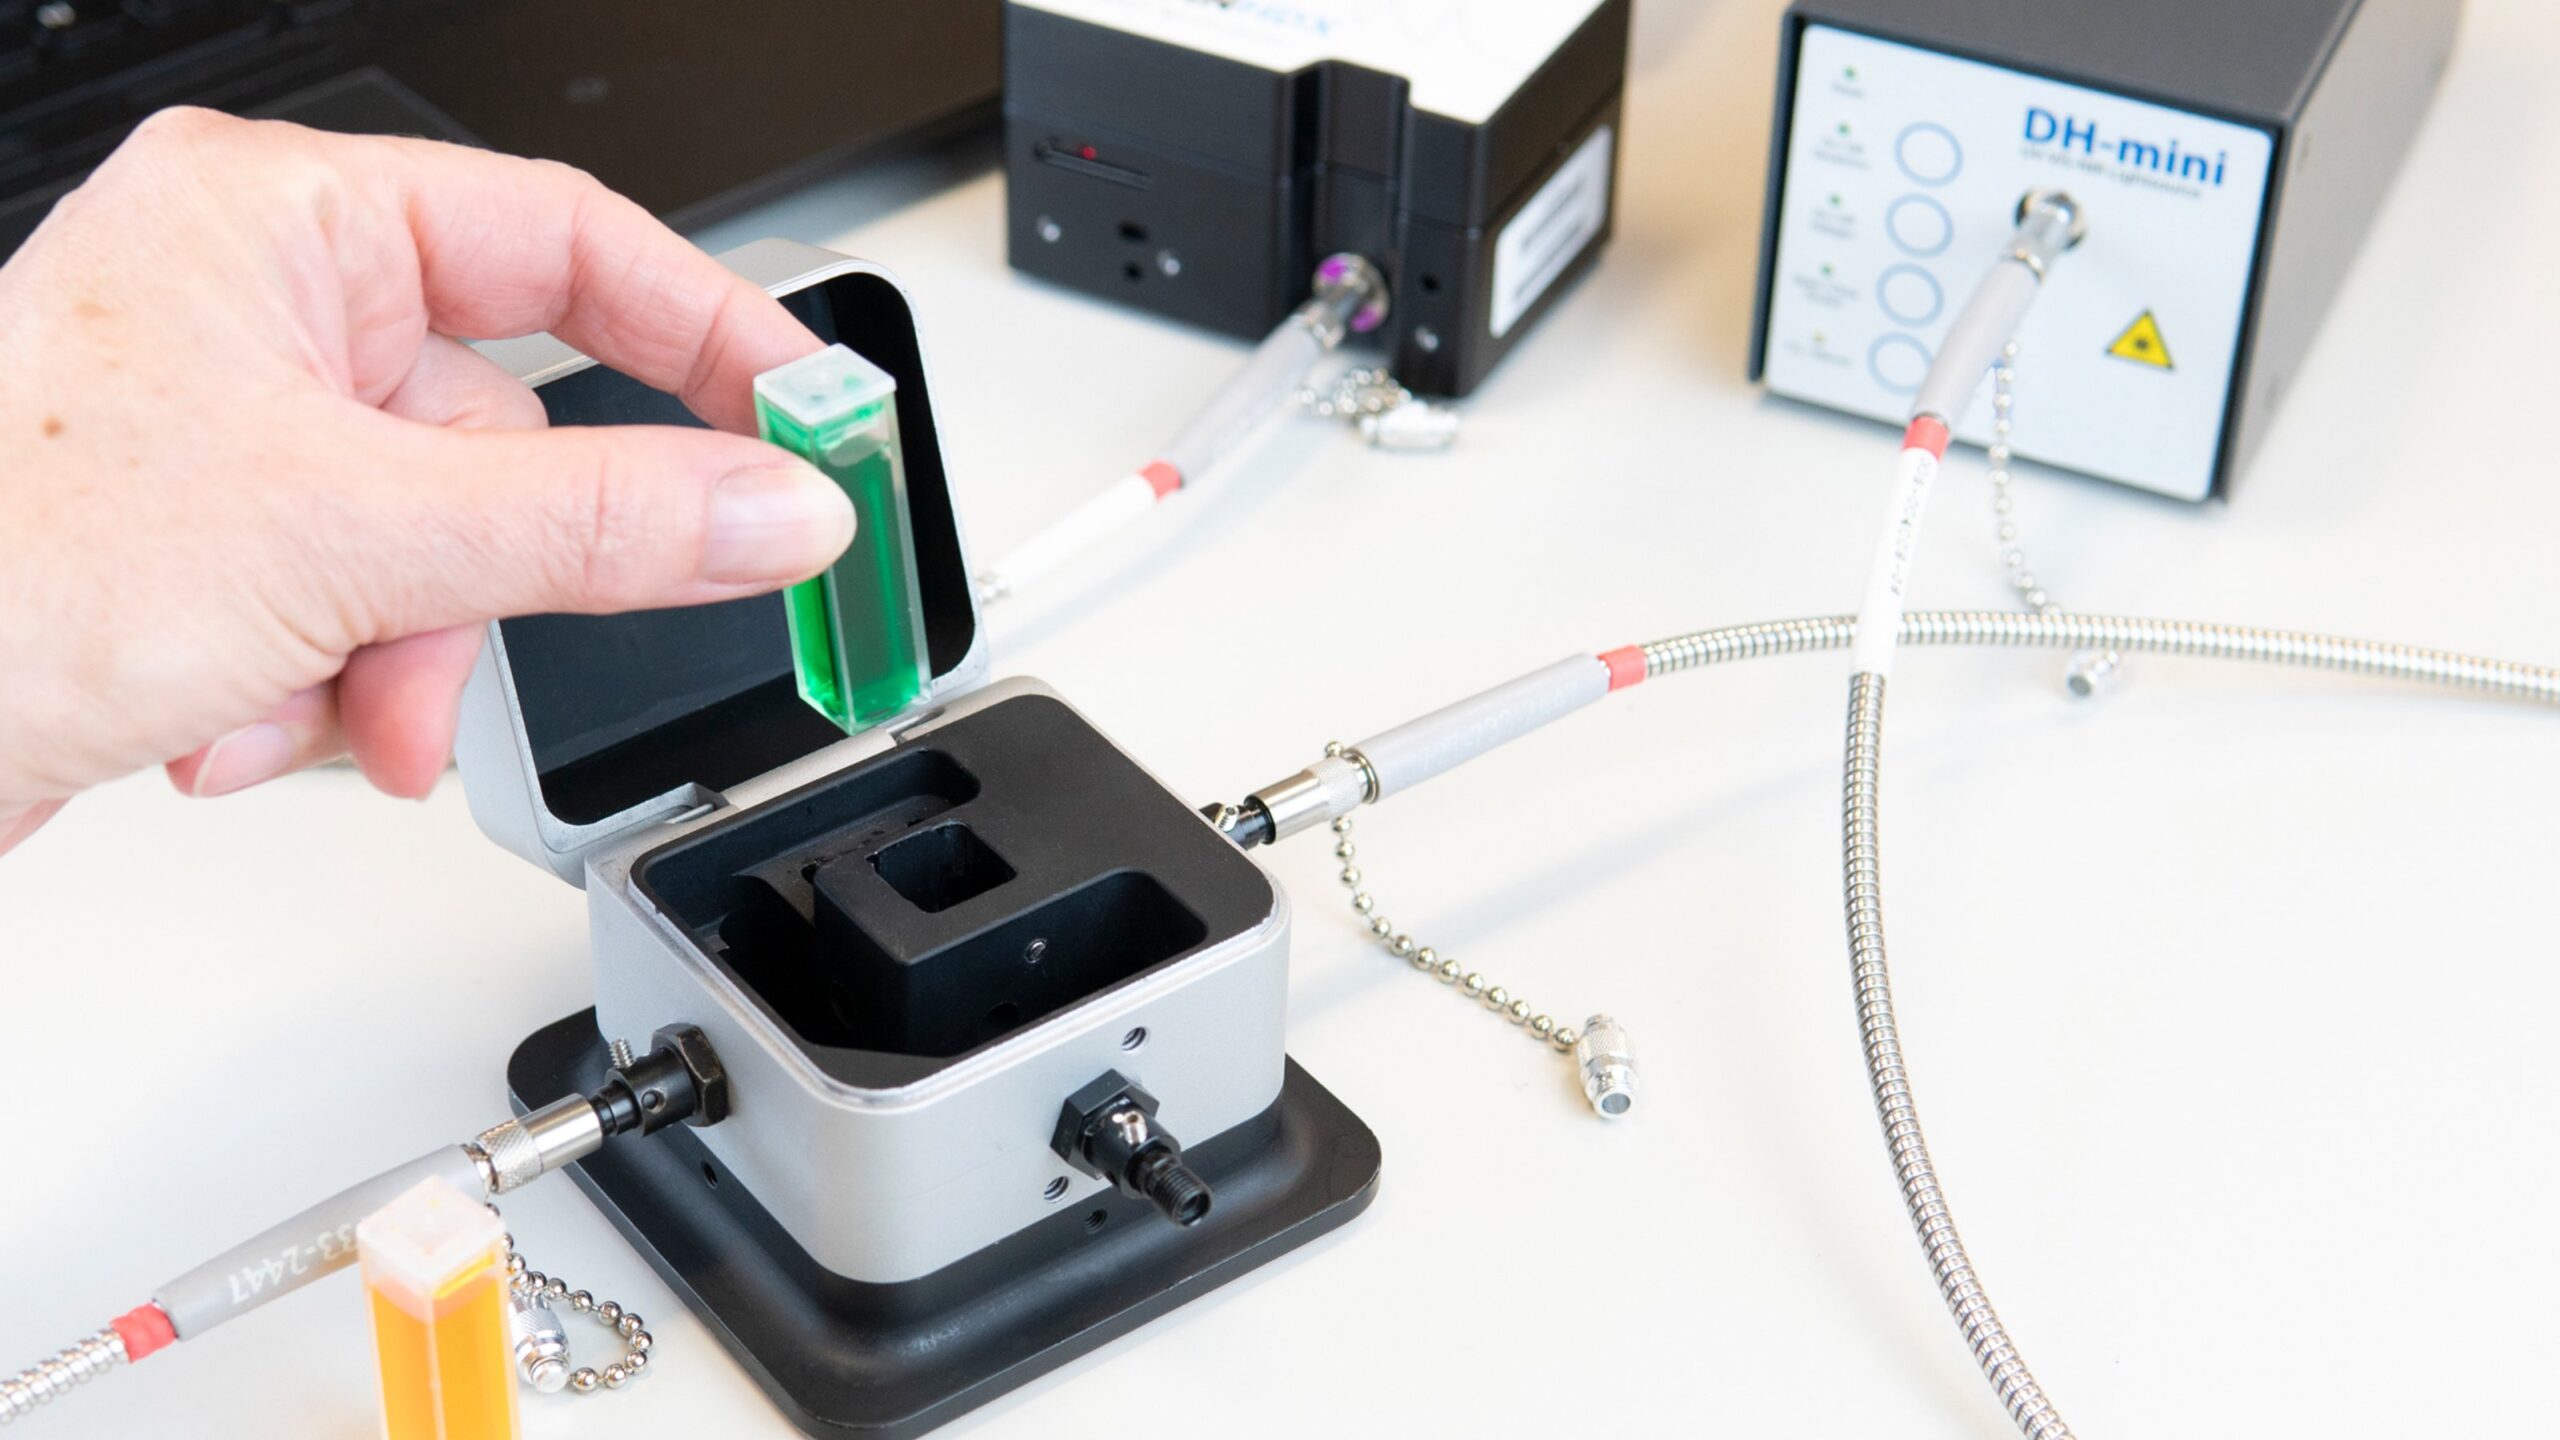
First, allow the light source to reach thermal equilibrium, which can take up to 30 minutes from start-up. Once the reference is acquired, view the resulting spectrum in transmission mode. If an accurate reference has been stored, transmission of the reference solution should be 100%, with some spectral noise around this value. Wavelength regions with more noise indicate the wavelengths at which the least accurate measurements will be made (typically, the shortest and longest wavelengths, or “edges” of the spectrum). - Make an effective dark measurement.
When taking a dark measurement, block the light at the light source. Turning the light source off and on again will affect its thermal equilibrium and require a new reference measurement. Alternatively, many cuvette holders have a filter slot where the light can be blocked. Use a piece of metal or object that is 100% opaque. Paper, even cardboard, can be deceptively transmitting, and it takes only a very low level of light to affect a measurement. - Prevent contamination of your sampling setup.
Ensure that all surfaces of the cuvette are clean and clear of fingerprints, dust and dirt. Fill the cuvette with the solvent or buffer solution to be used for the sample, and check for bubbles. Also, be mindful of checking for bubbles when using a transmission dip probe or flow cell, as these devices are prone to errors from bubbles, especially at shorter pathlengths.
- Optimize your spectrometer settings.
-
Laser Induced Breakdown Spectroscopy (LIBS) Podcast: Listen to Expert Insights

The Applied Spectral Knowledge Podcast is a forum for tips and insights on spectral sensing challenges. In the latest episode of our series, Ocean Insight experts offer some valuable advice on LIBS technology.
(more…) -
Gemstone Analysis and Authentication

Gemstones are a multibillion-dollar industry, with growing markets in countries including China and India contributing to the boom. As demand increases, forecasters anticipate that prices will rise – and boost the prevalence of counterfeit gemstones as a result. Read more to learn how spectroscopy helps identify counterfeits.
(more…)