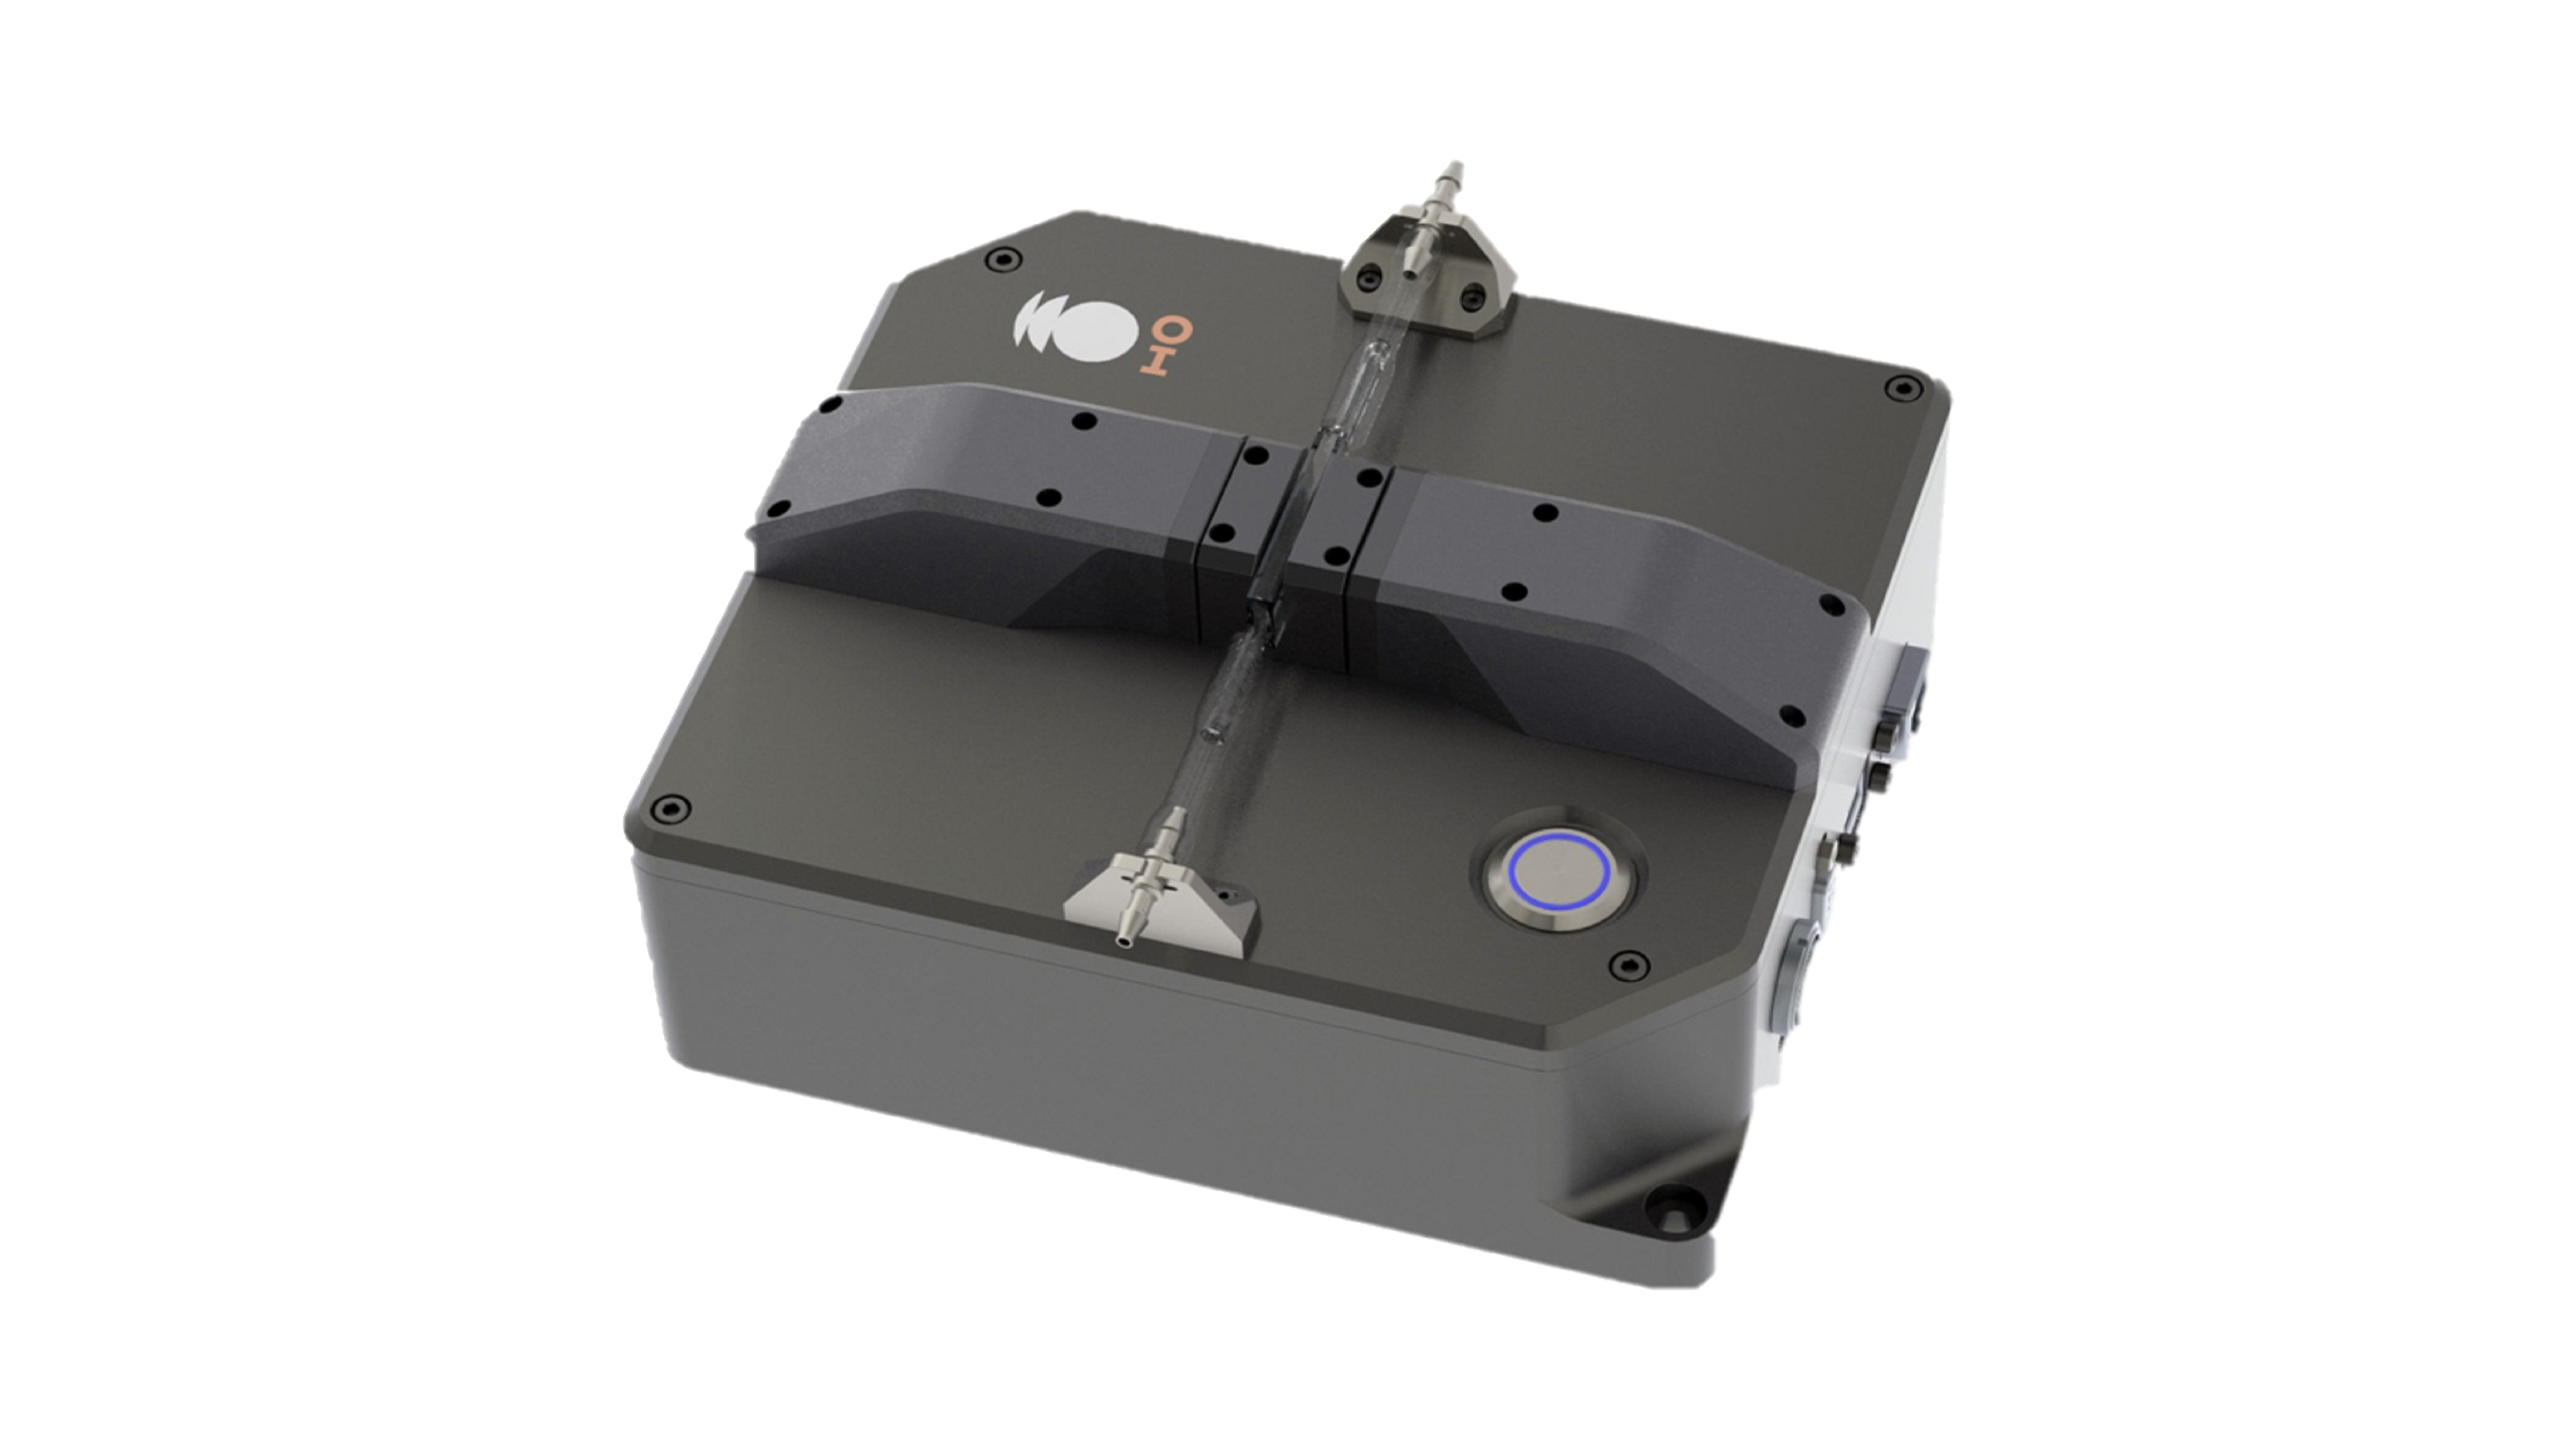
Ocean Insight’s Liquid Transmission Measurement System (LTMS) is a spectroscopic-based instrument designed for real-time, automated concentration measurements in anodization dyes and other liquids in industrial environments.
(more…)-
Five Simple Rules for Fiber and Probe Maintenance
Ocean Optics optical fiber assemblies, probes and accessories allow users to transmit and collect light in our spectrometer setups. From off-the-shelf patch cords and custom fibers to specially engineered OEM assemblies, your fiber options are as varied as your applications. Here are some tips to ensure reliable, long-lasting fiber and probe performance.
Rule #1: Choose Wisely
Modular spectral systems are only as good as the sum of their individual parts. The same care you put into choosing a spectrometer should go into choosing a light source, the sampling optics, and the fibers or a probe. Are you measuring absorbance or reflectance? Are you measuring wavelengths below 270 nm, where UV exposure can solarize certain fibers? Where will the fiber be placed in your setup? Is the sample environment chemically harsh? Determining those criteria will help us guide you to the optimum combination of components – including fibers – that meets your needs and tolerates sample conditions.Rule #2: Handle Fiber Connectors and Terminations Carefully
Without proper care, SMA 905 and other fiber connectors can be scratched or damaged and affect measurements. On occasion, customers have even inadvertently separated the connector or ferrule from its fiber or probe assembly by pulling on the end too forcefully.Since the ends of fibers receive the most wear and tear, manufacturers design terminations with extra strain relief and boot collar protection. But just be mindful when removing end caps to use one hand to hold the fiber by the connector and the other to pull off the end cap. Ocean Optics XSR extreme solarization-resistant fibers go one step further by having an end cap that screws on to the end of the fiber — no pulling necessary.
Rule #3: Mind the Bend Radius
Although optical fibers and probes are used to move light around your spectrometer setup, there is a limit to how much bending those assemblies can tolerate. The bend radius of a fiber denotes how sharply the fiber can bend before damage occurs in the fiber. This damage can range from fiber attenuation to fiber breakage, which leads to even more dramatic light loss.That’s why it’s good practice to inspect fibers periodically to ensure that light transmission is occurring. Broken fibers stop transmitting light.
Ocean Optics reports both long-term bend radius (LTBR) and short-term bend radius (STBR). LTBR is the minimum bend radius recommended for storage conditions. STBR is the minimum radius recommended during fiber use.
Bend Radius for Visible-NIR, UV-Visible and Solarization-resistant and Extreme SR Fibers
Fiber Core Size Fiber Types LTBR STBR 50 ± 5 μm VIS-NIR, UV-VIS 4 cm 2 cm 100 ± 3 μm VIS-NIR, UV-VIS 4 cm 2 cm 113 ± 6 μm (115 μm nominal) XSR 4 cm 2 cm 200 ± 4 μm VIS-NIR, UV-VIS, SR 8 cm 4 cm 230 ± 12 μm XSR 4 cm 2 cm 300 ± 6 μm SR 12 cm 6 cm 400 ± 8 μm VIS-NIR, UV-VIS, SR 16 cm 8 cm 455 ± 22 μm XSR 8 cm 4 cm 500 ± 10 µm VIS-NIR, UV-VIS 20 cm 10 cm 600 ± 10 μm VIS-NIR, UV-VIS, SR 24 cm 12 cm 600 ± 30 μm XSR 24 cm 12 cm 1000 ± 3 µm VIS-NIR 30 cm 15 cm 1000 ± 20 µm UV-VIS 30 cm 15 cm Rule #4: Avoid Excessive Heat
Avoid exceeding the temperature thresholds for the fiber materials: For standard fibers, the temperature threshold for the silica fiber is 300 °C, while the epoxy and PVDF zip tube are rated to 100 °C. For premium-grade fibers, the entire assembly is rated to 220 °C. Jacketing options including stainless BX offer better protection, but it’s always best to consult your Ocean Optics representative for assistance with applications in challenging environments.As one university professor recently shared with us, some Ocean Optics optical fibers in his freshman chemistry lab had “survived” 20 years in the hands of beginning chemists. These fibers might have lasted longer, but a few students got those fibers too close to the flame of the Bunsen burner they were measuring, melting the fiber boot collar and PVDF zip tube.
Chemical resistance is another criteria that may be important for your application. Avoid immersing the fiber in materials that can damage quartz, nickel, steel, aluminum, or the epoxy. In harsh sample environments, choosing durable jacketing materials including silicone monocoil or stainless steel BX is your best bet. Custom sleeves and ferrules are another option.
Rule #5: Remember the Little Stuff
Although this might not always be practical, it’s helpful to replace the end caps on optical fiber connectors when the fibers aren’t in use. This helps to prevent scratches and avoid contamination from dust and fingerprints. Also, we suggest cleaning the fiber ends periodically with lens paper and distilled water, alcohol, or acetone. Avoid scratching the surface. -
FAQ of the Month: Absorbance Measurement Tips
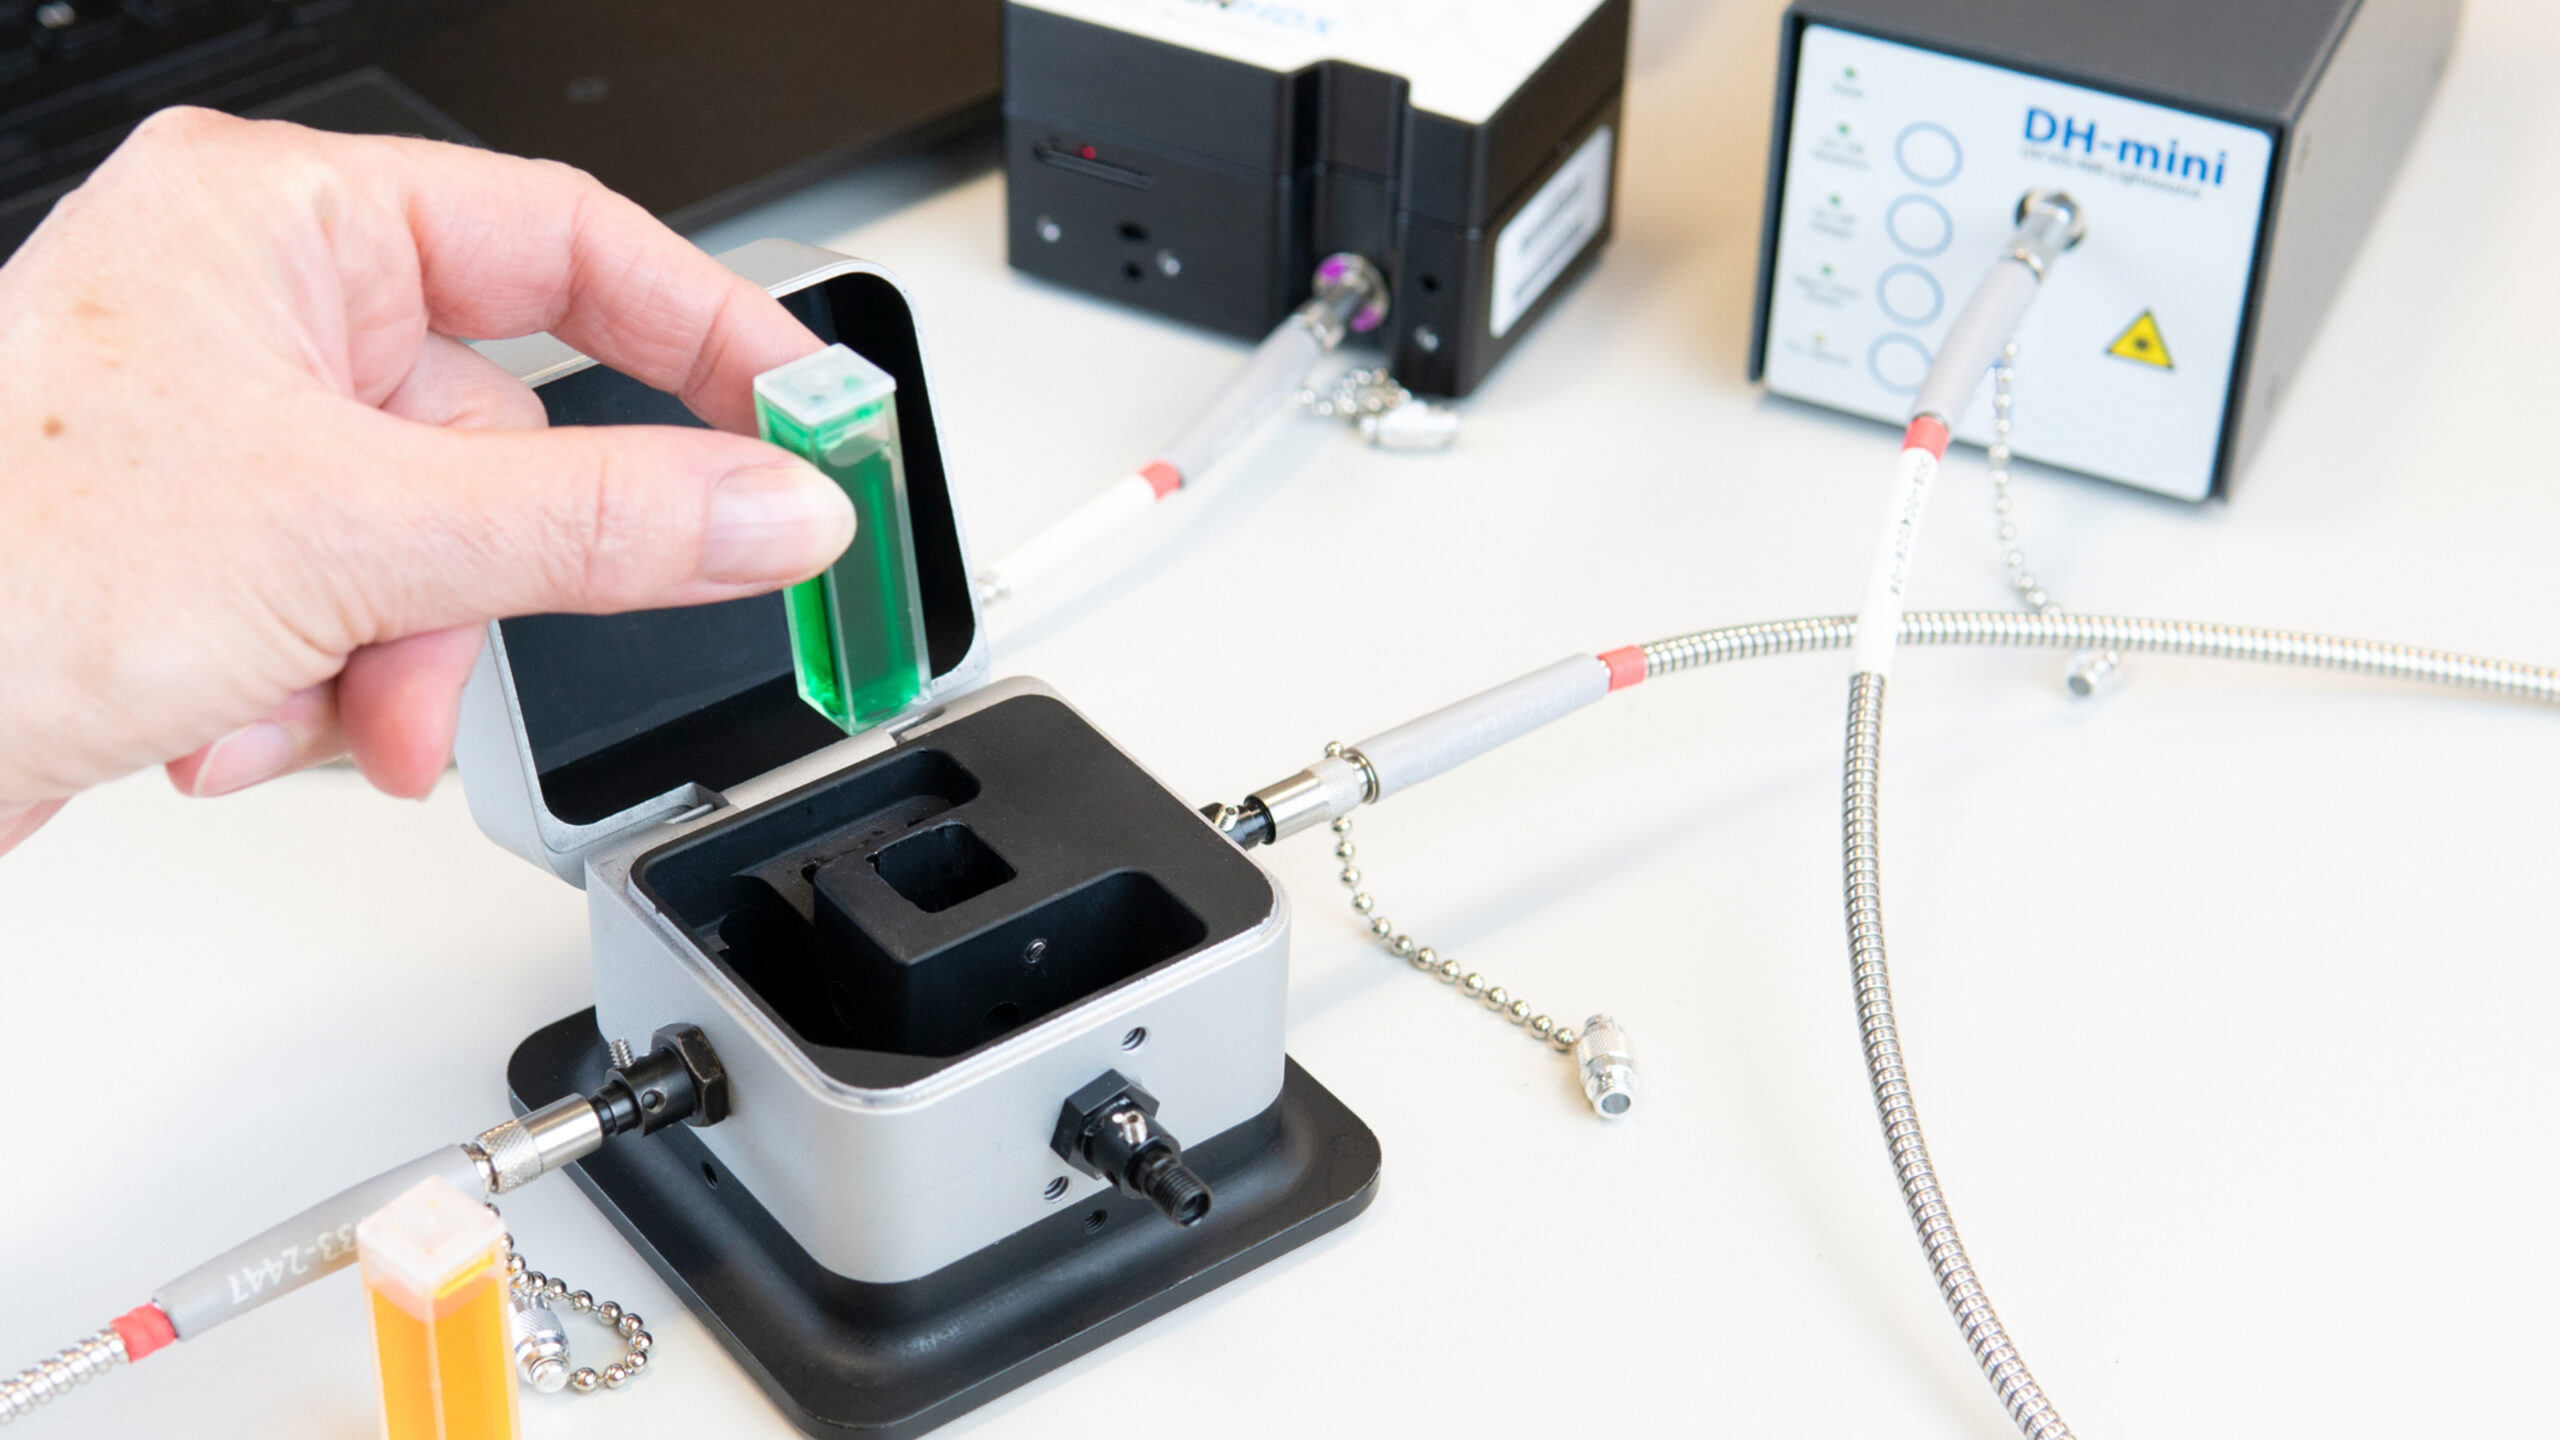
Our FAQs section has simple, clear-cut answers to questions about Ocean Optics products, measurements and software. In the spotlight: two keys to reference and dark background measurements for absorbance applications.
Q: How do I take the best reference and dark background spectrum for an absorbance measurement?
A: To take the best reference measurement, first allow the light source to come to thermal equilibrium (this can take up to 30 minutes in some cases).
Ensure that all surfaces of the cuvette or sampling optics are clean and clear of fingerprints, dust, and dirt. Fill the cuvette with the exact solvent or buffer solution to be used for the sample and check for bubbles. It is especially important to check for bubbles if you’re using a transmission dip probe or flow cell, as those devices are prone to this source of error, particularly at the shorter pathlengths.
In OceanView software, optimize integration time so that maximum signal is at ~80% of full scale. Use the highest number of averages tolerable and keep boxcar width to approximately the same value as the pixel resolution of the spectrometer, otherwise the setting can affect the spectral resolution.
Once the reference has been acquired, enter transmission mode in software and review the resulting spectrum. If a good quality reference spectrum has been stored, the transmission of the reference solution should be at 100%, with some noise around this value. Wavelength regions with more noise indicate the wavelengths at which accuracy will be the least (i.e., most affected by noise and other factors) for the sample measurement (typically the shortest and longest wavelengths).
When taking a dark measurement, it’s best to block the light at the light source if possible. Turning the light source off and on again will throw the light source out of thermal equilibrium and require a new reference measurement.
Alternatively, many cuvette holders have a filter slot where the light can be blocked with an opaque object. Just be sure to use a piece of metal or other object that is guaranteed to be 100% opaque. Paper, even cardboard, can be deceptively transmitting; it takes only a very low level of light to affect a measurement.
-
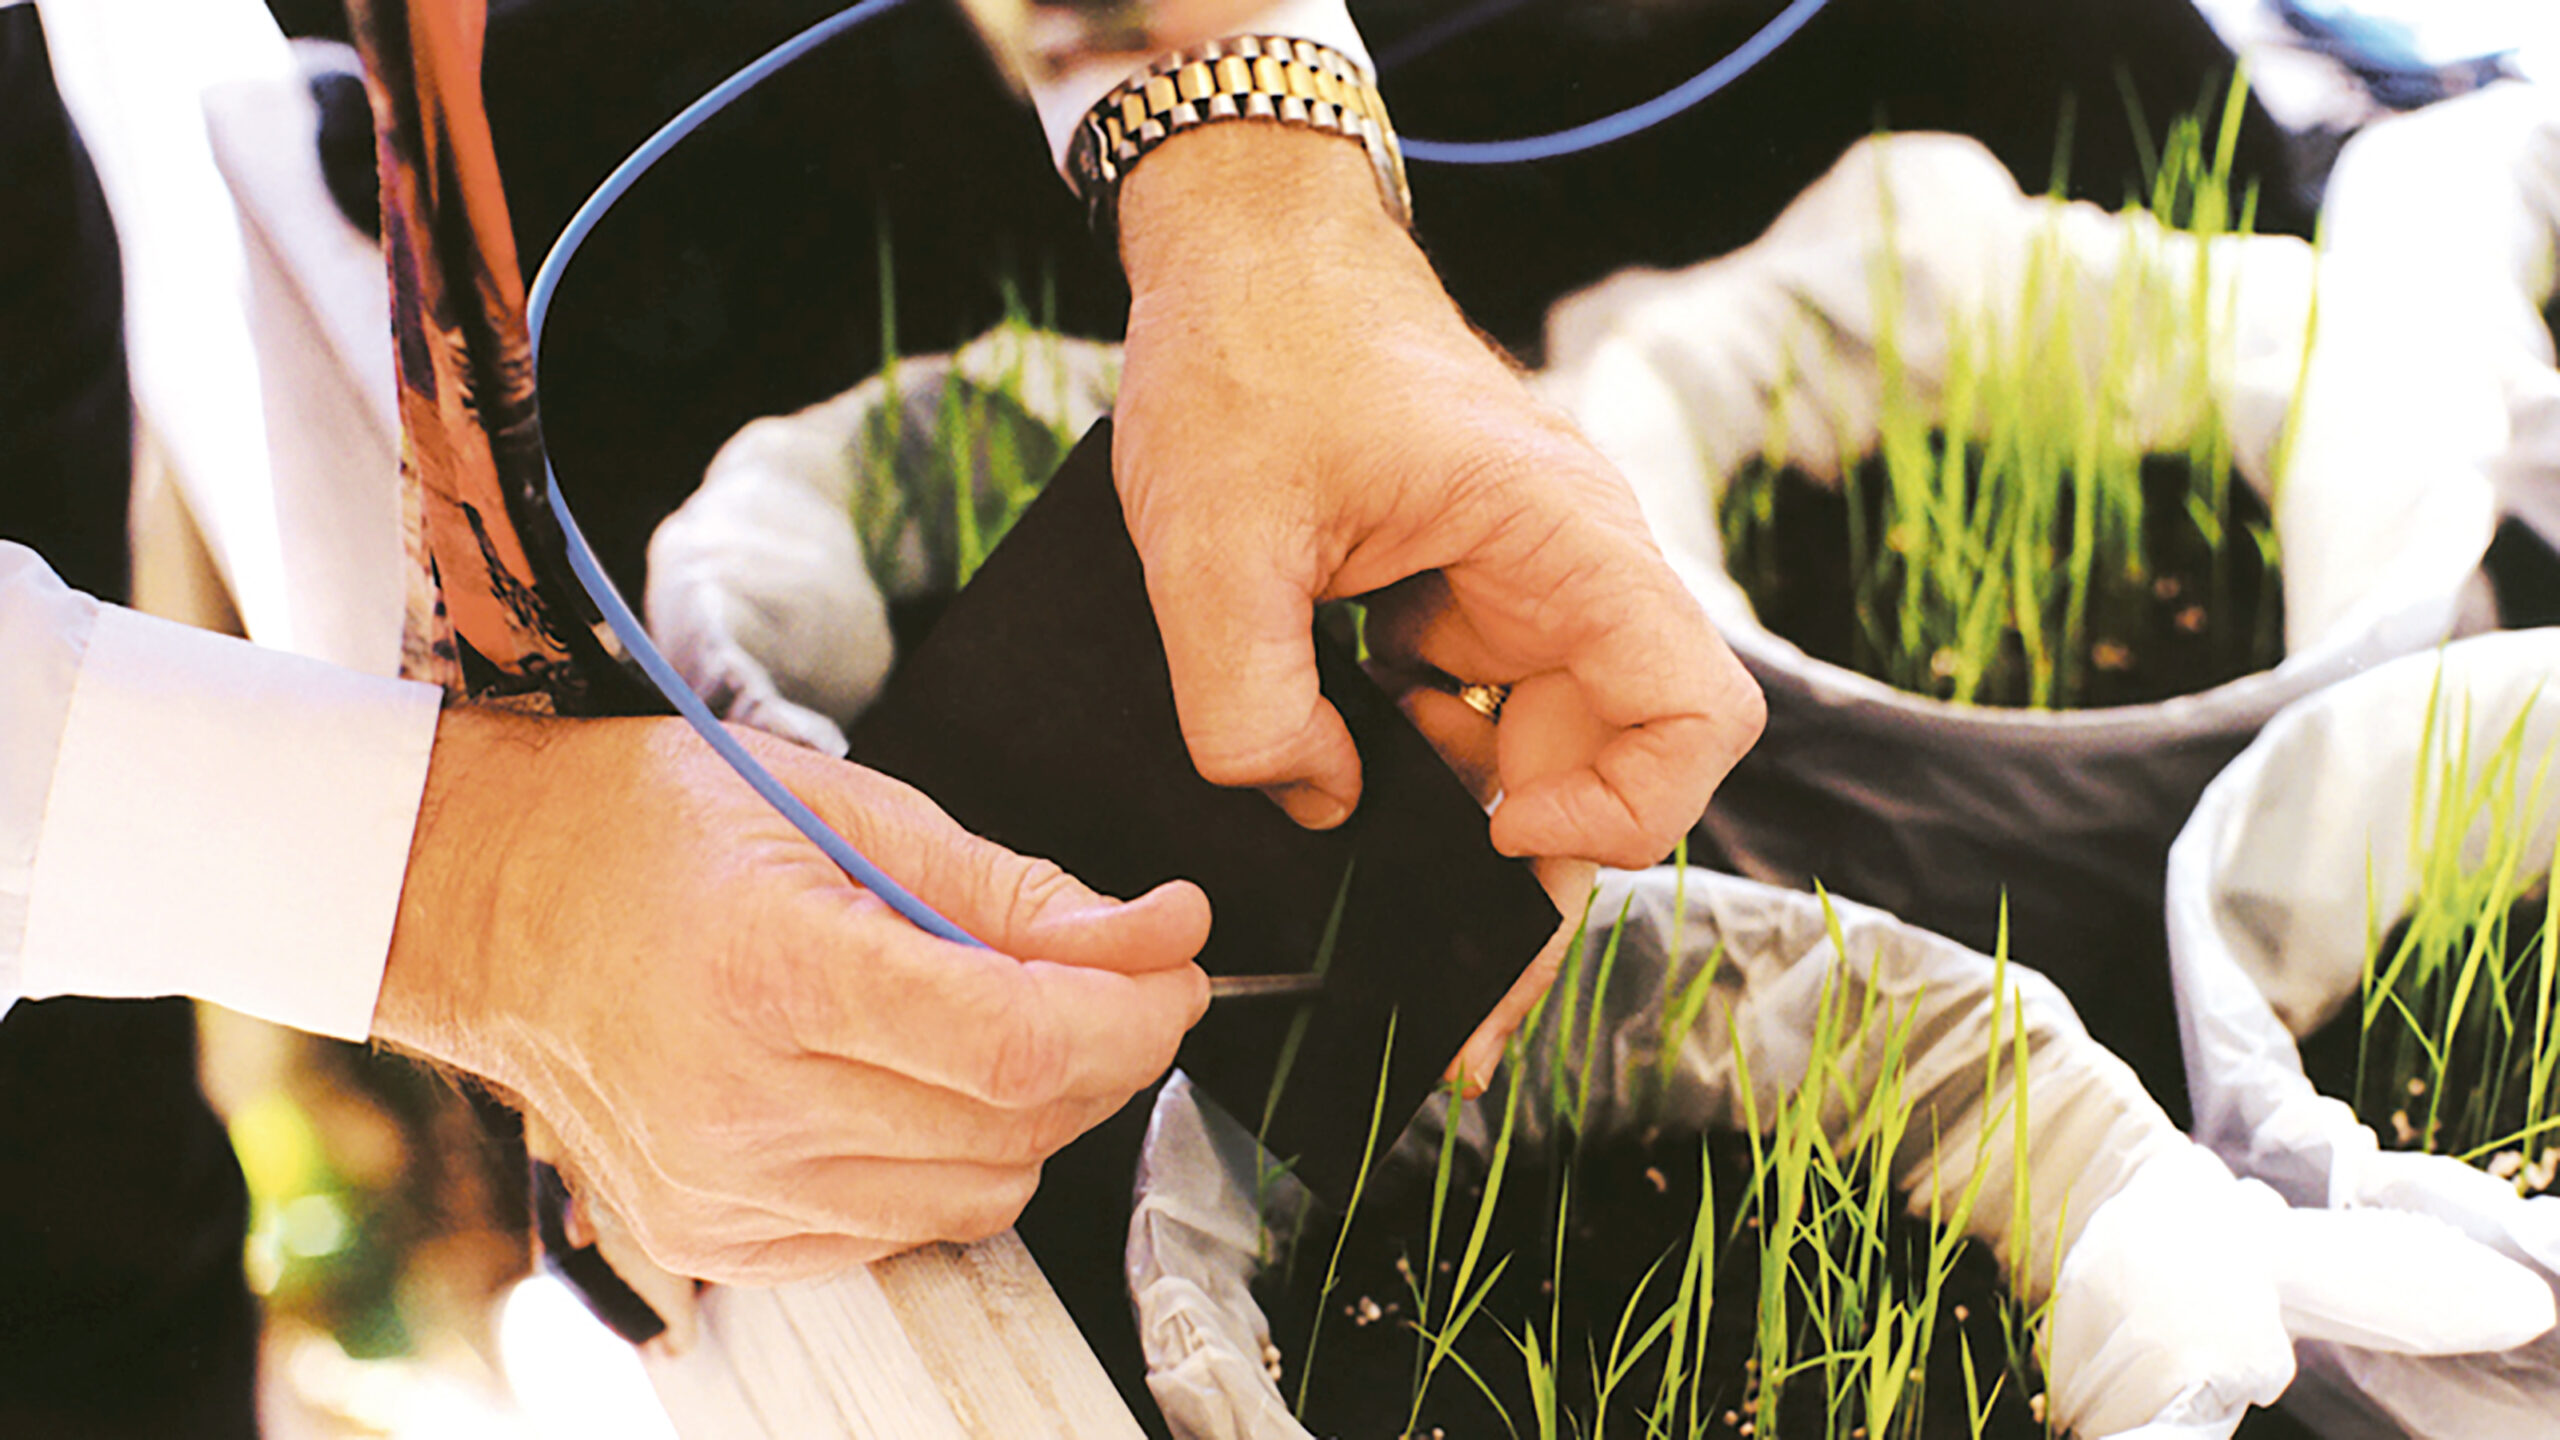
Optical Sensing Solutions for Aquaculture

Aquaculture and fish farming require careful monitoring of conditions to ensure healthy, sustainable production. Techniques including spectroscopy and oxygen sensing are useful analytical tools in aquaculture settings.
(more…) -
How Clean is Our Water?

In this post and its accompanying video, we measure the spectra of various drinking and surface water samples and share information on an organization working to ensure clean water for all.
IMPORTANT: PLEASE REFRESH YOUR BROWSER IF YOU DO NOT SEE ANY IMAGES/SCREENSHOTS/SPECTRA ON THE PAGE.
The confluence of two recent events – a trip to the local grocery store and our company’s relationship with the charitable organization WaterAid – inspired our investigation of several types of bottled and surface waters. Here’s what our initial analysis revealed.
Bottled and Tap Water Samples
In the U.S. and other developed countries, drinking water – whether it comes from local municipalities via the tap or from manufacturers that bottle it at the source – is carefully regulated, widely available and often taken for granted. Using an Ocean HDX spectrometer, we were curious to measure some samples to determine any spectral differences.
We began with several bottled water samples from a local grocery that’s part of a bigger chain in the southeastern U.S. First up: spring water. According to the U.S. Food and Drug Administration, spring water is “derived from an underground formation from which water flows naturally to the surface of the earth.” These spring water samples appeared to vary in composition (sometimes dramatically) depending on what facility they came from (Figure 1).
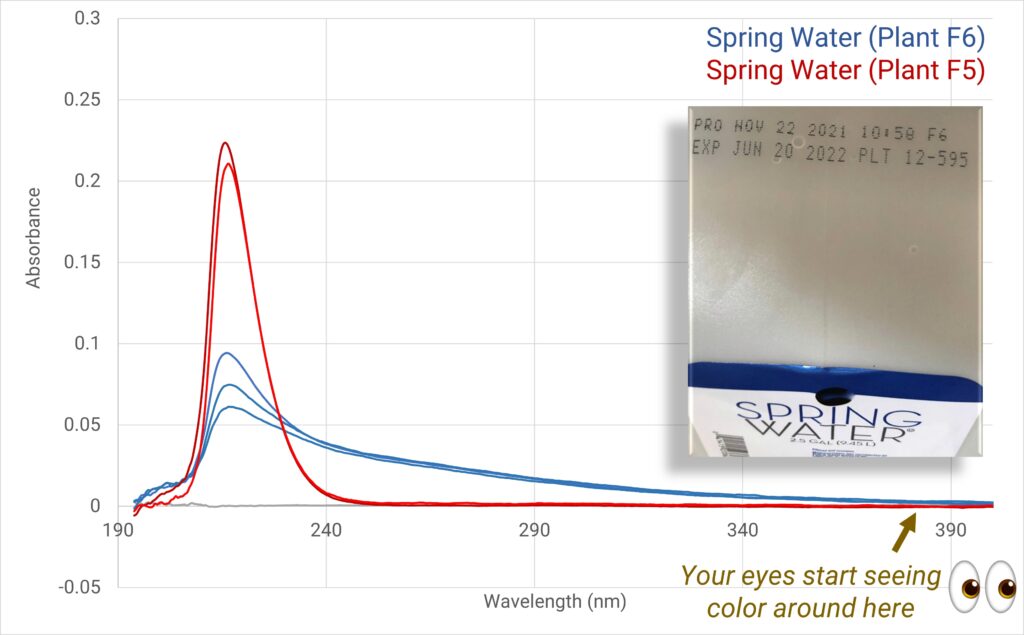
Figure 1. Grocery-store brand spring water We next measured drinking water, a designation for water used in drink or food preparation. Our drinking water sample from the same grocery store revealed more UV spectral activity (Figure 2) than in the spring water, suggesting the possible presence of more dissolved solids and/or organics.
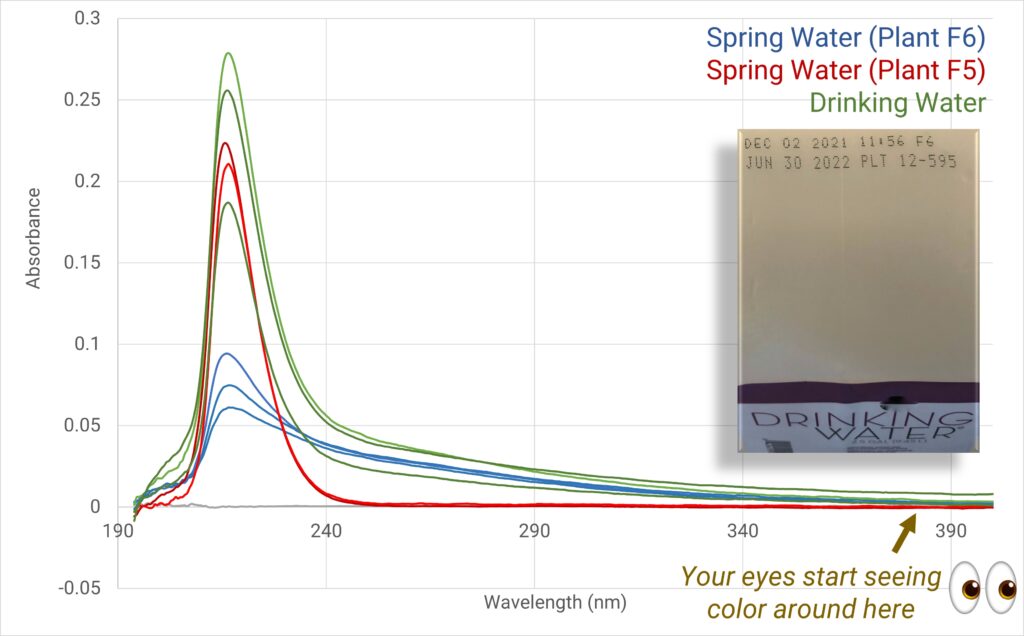
Figure 2. Grocery-store brand drinking water For comparison, we also tested a local tap water sample. It had a lower UV peak than the bottled water but showed more activity from 240-290 nm (Figure 3). This likely results from the addition of water treatments such as fluoride and from trace contaminants in the pipelines that transport water from treatment facilities.
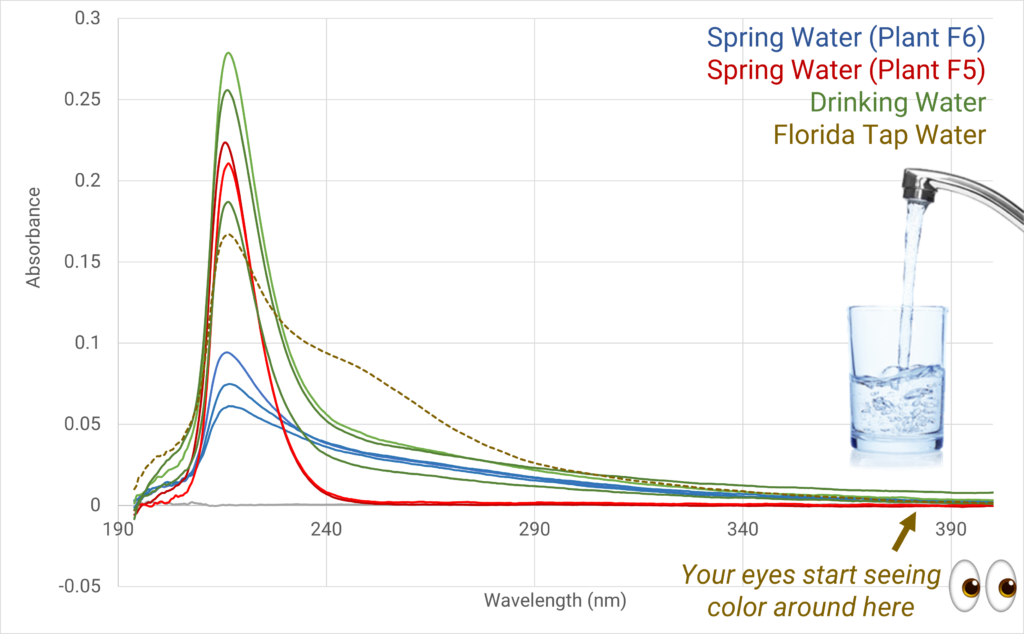
Figure 3. Municipal (tap) water, St. Petersburg, Fla. To round out our survey of regulated water sources, we measured a sample of an expensive bottled water brand. Although this water is about 6x the cost for a case (24) of 16.9 oz. (500 ml) bottles, the expensive-brand samples we tested had very similar spectral characteristics as the store-brand spring water samples (Figure 4). Consumers don’t seem to mind the extra expense – according to several sources, the top bottled water brands have annual sales in the billions.
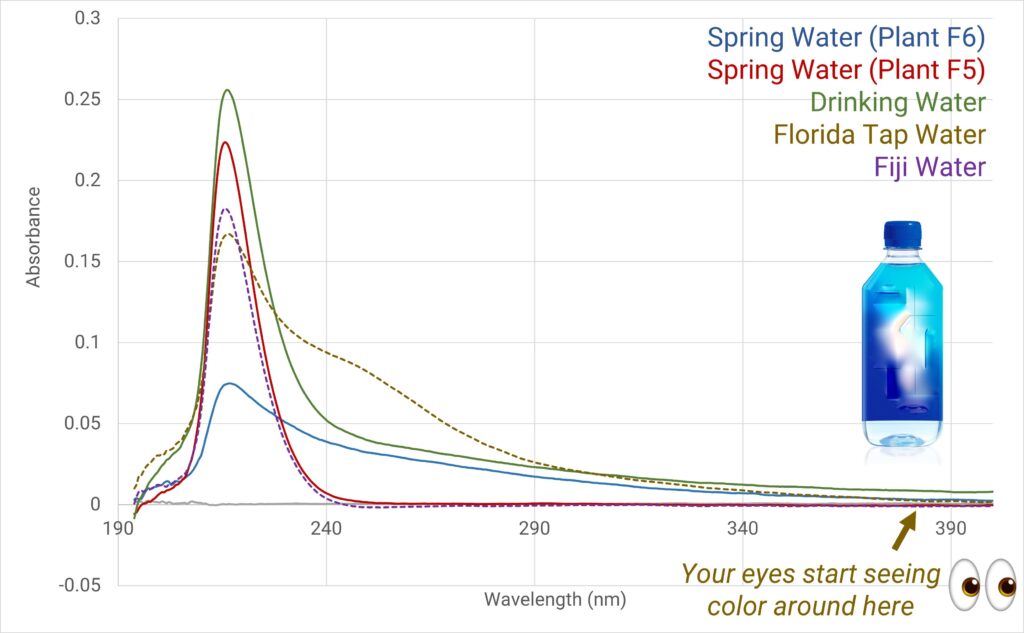
Figure 4. High-end bottled water Snowmelt, Ground Snow and Lake Water Samples
To better appreciate the water quality (or lack thereof) that many people in less developed countries experience, we also tested surface water from two separate areas of the U.S., in two very different regions.
In the Pacific Northwest, we tested both snowmelt (Figure 5) and ground snow (Figure 6) collected on or near Mt. Spokane, Washington. For context, Mt. Spokane has an elevation of nearly 6,000 ft., averages about 163 inches (413 cm) of snowfall annually, and is about 35 miles from Spokane, a city of approximately 220,000. Interestingly, the Mt. Spokane water samples were very similar spectrally to the grocery store spring water and drinking water samples.
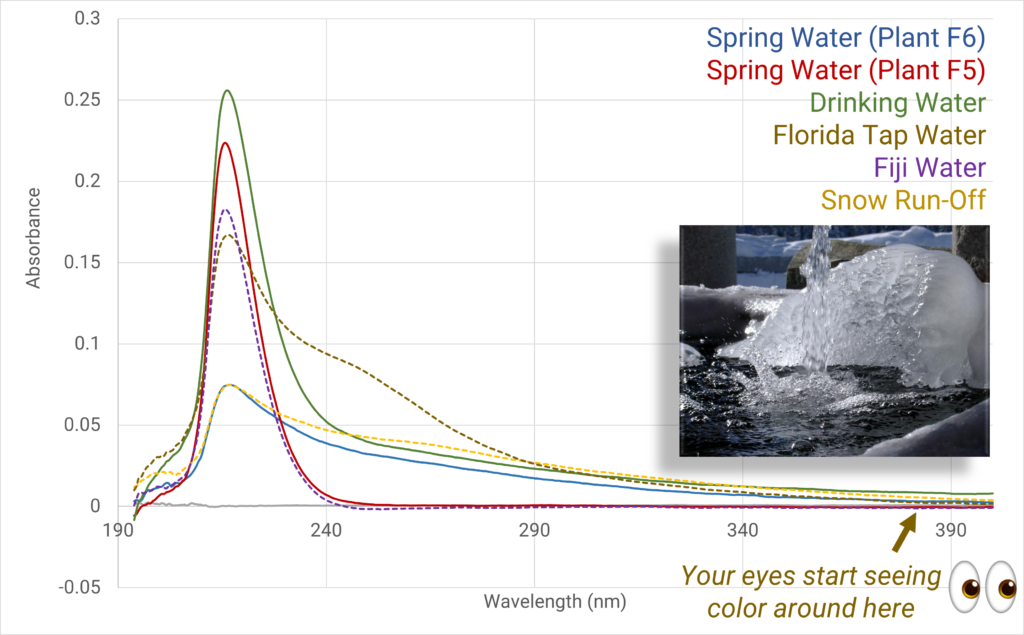
Figure 5. Snowmelt, Mt. Spokane, Wash. 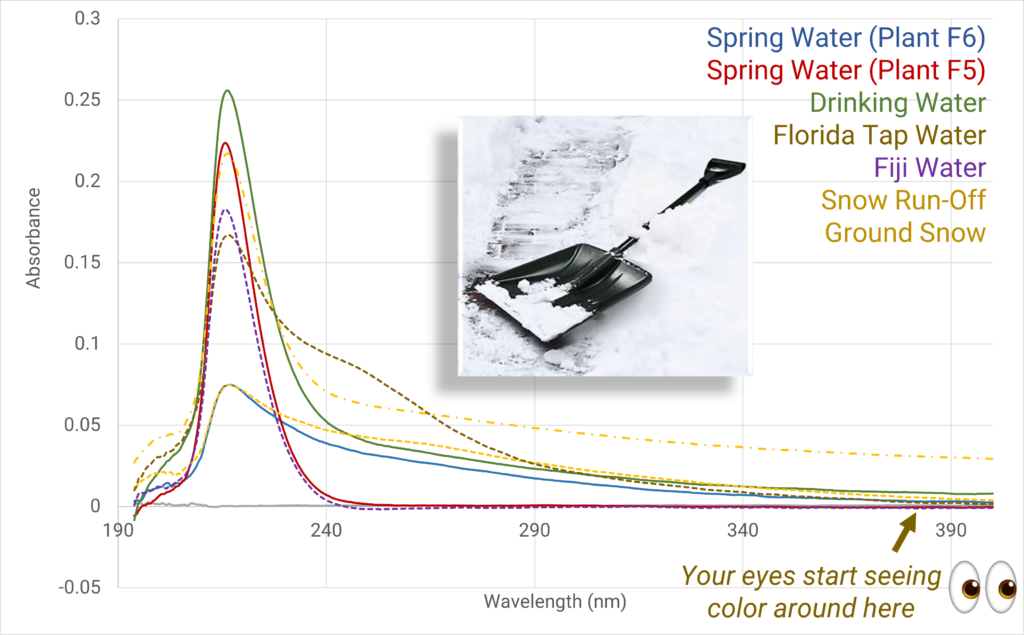
Figure 6. Ground snow, Mt. Spokane, Wash. In contrast, the sample we collected from a Florida lake had such a strong response in the UV that the spectra are off-scale (Figure 7), which is suggestive of contaminants. It’s only when we rescale the results that we can fully appreciate the dramatic difference (Figure 8). This water quality level is similar to – and in many cases, better than – the only water available to nearly a billion people around the world.
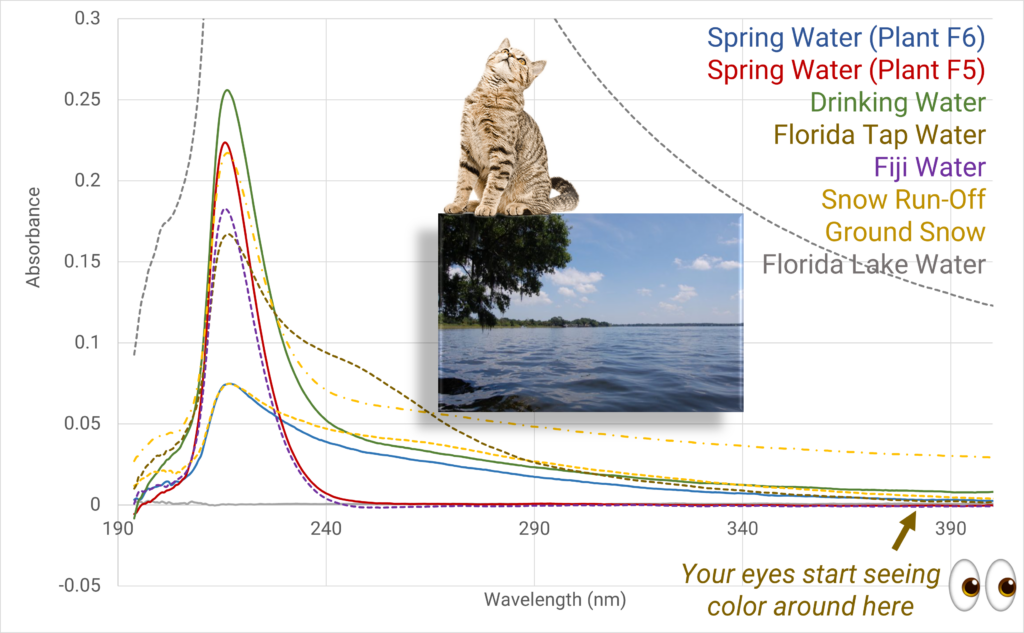
Figure 7. Lake water, St. Petersburg, Fla.
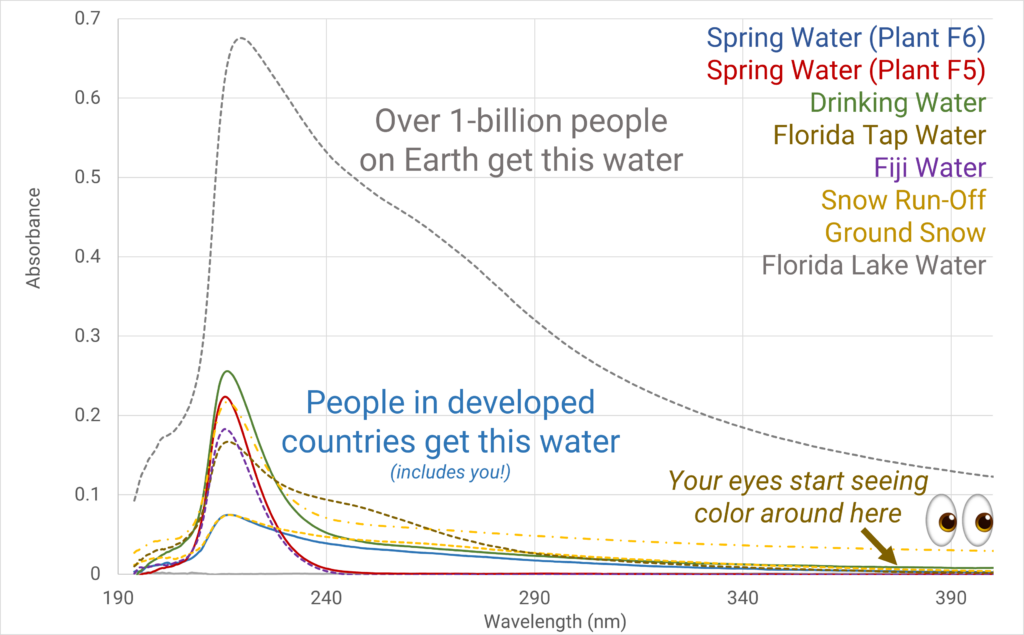
Figure 8. All water samples But there are organizations like WaterAid that are helping to bridge the gap for the 1 in 10 people worldwide without access to clean water.
About WaterAid
WaterAid is one of several international, charitable organizations dedicated to making clean water, decent toilets and good hygiene a normal part of everyday life for people everywhere. In conjunction with our parent company Halma plc, Ocean Insight is supporting a fundraising effort on behalf of WaterAid called Water for Life. The aim of this campaign is to transform lives in eastern India by bringing clean water to 8,000 people in Bihar, a remote area with limited access to safe drinking water.
-
Can Spectroscopy Assess Paint Samples Quickly and Easily?

In this application to analyze paint formulations, an Ocean Optics spectrometer setup measures the reflectance of painted surfaces.
Paint and coating materials comprise components including pigments, dyes, fillers and binders, with careful mixing of each element contributing to product quality and performance. The ability to evaluate different paint formulations and UV-protective coatings within minutes versus hours can make a big difference in development time and cost.
Experimental Setup
For fast, convenient assessment of paint samples on flat surfaces and substrates, we used an extended-range (UV-Visible-NIR) spectrometer with a broadband light source, integrating sphere for reflectance, and diffuse reflectance standard. This modular setup allowed us to quickly characterize the diffuse, specular and total reflectance characteristics of each sample.
Equipment Used
- Ocean HDX-XR extended range spectrometer (200-1100 nm)
- INTSMA-025 customer-changeable entrance slit
- DH-2000-BAL deuterium-tungsten halogen light source (200-2500 nm)
- ISP-50-8-R-GT integrating sphere with gloss trap
- (2) QP600-1-XSR 600 µm extreme solarization-resistance optical fibers
- WS-1-SL Spectralon® diffuse reflectance standard
- STAN-HOLDER reflectance standard holder
Because integrating spheres attenuate light levels significantly during reflectance measurements, we selected the Ocean HDX-XR as our spectrometer, for its great sensitivity from 200-1100 nm. The additional slit provides versatility.
The ISP-50-8-R-GT integrating sphere has a 50 mm sphere diameter and gloss trap to enable diffuse and total reflectance measurements. The 600 um core diameter of the fibers matches the optical needs of the integrating sphere, while the fibers’ extreme solarization-resistant properties mitigate degradation that can occur in fibers in the UV region. The STAN-HOLDER is a convenient accessory that can act as both a reflectance standard holder and a sample stage.
Measurements
We analyzed five samples applied to flat surfaces: three different white paints, a highly reflective UV aluminum strip, and a highly absorptive UV strip.
Samples were measured with an integrating sphere containing a gloss trap, so both total reflectance (gloss trap closed) and diffuse reflectance (gloss trap open) could be measured for samples applied to the middle strip (area) of the flat surfaces. Also, measurements were made for high and low UV reflectivity samples and for the top, middle and bottom strips (no paint applied) of the surfaces. Each sample was measured at three different locations and the spectral data averaged.
All samples were referenced to a Spectralon reflectance standard, which was held in a reflectance standard holder. Solarization-resistant fibers were used to connect the light source and spectrometer to the applicable ports on the integrating sphere. The integrating sphere was then inverted so the port of the sphere could be placed on the sample supported by the reflectance standard holder.
Reflectance was measured for three different locations on each sample with the gloss trap open and then closed (Figure 1). To avoid setup variability due to fiber movement during the measurements, the sphere was lifted slightly to change samples instead of moving the sphere between samples.
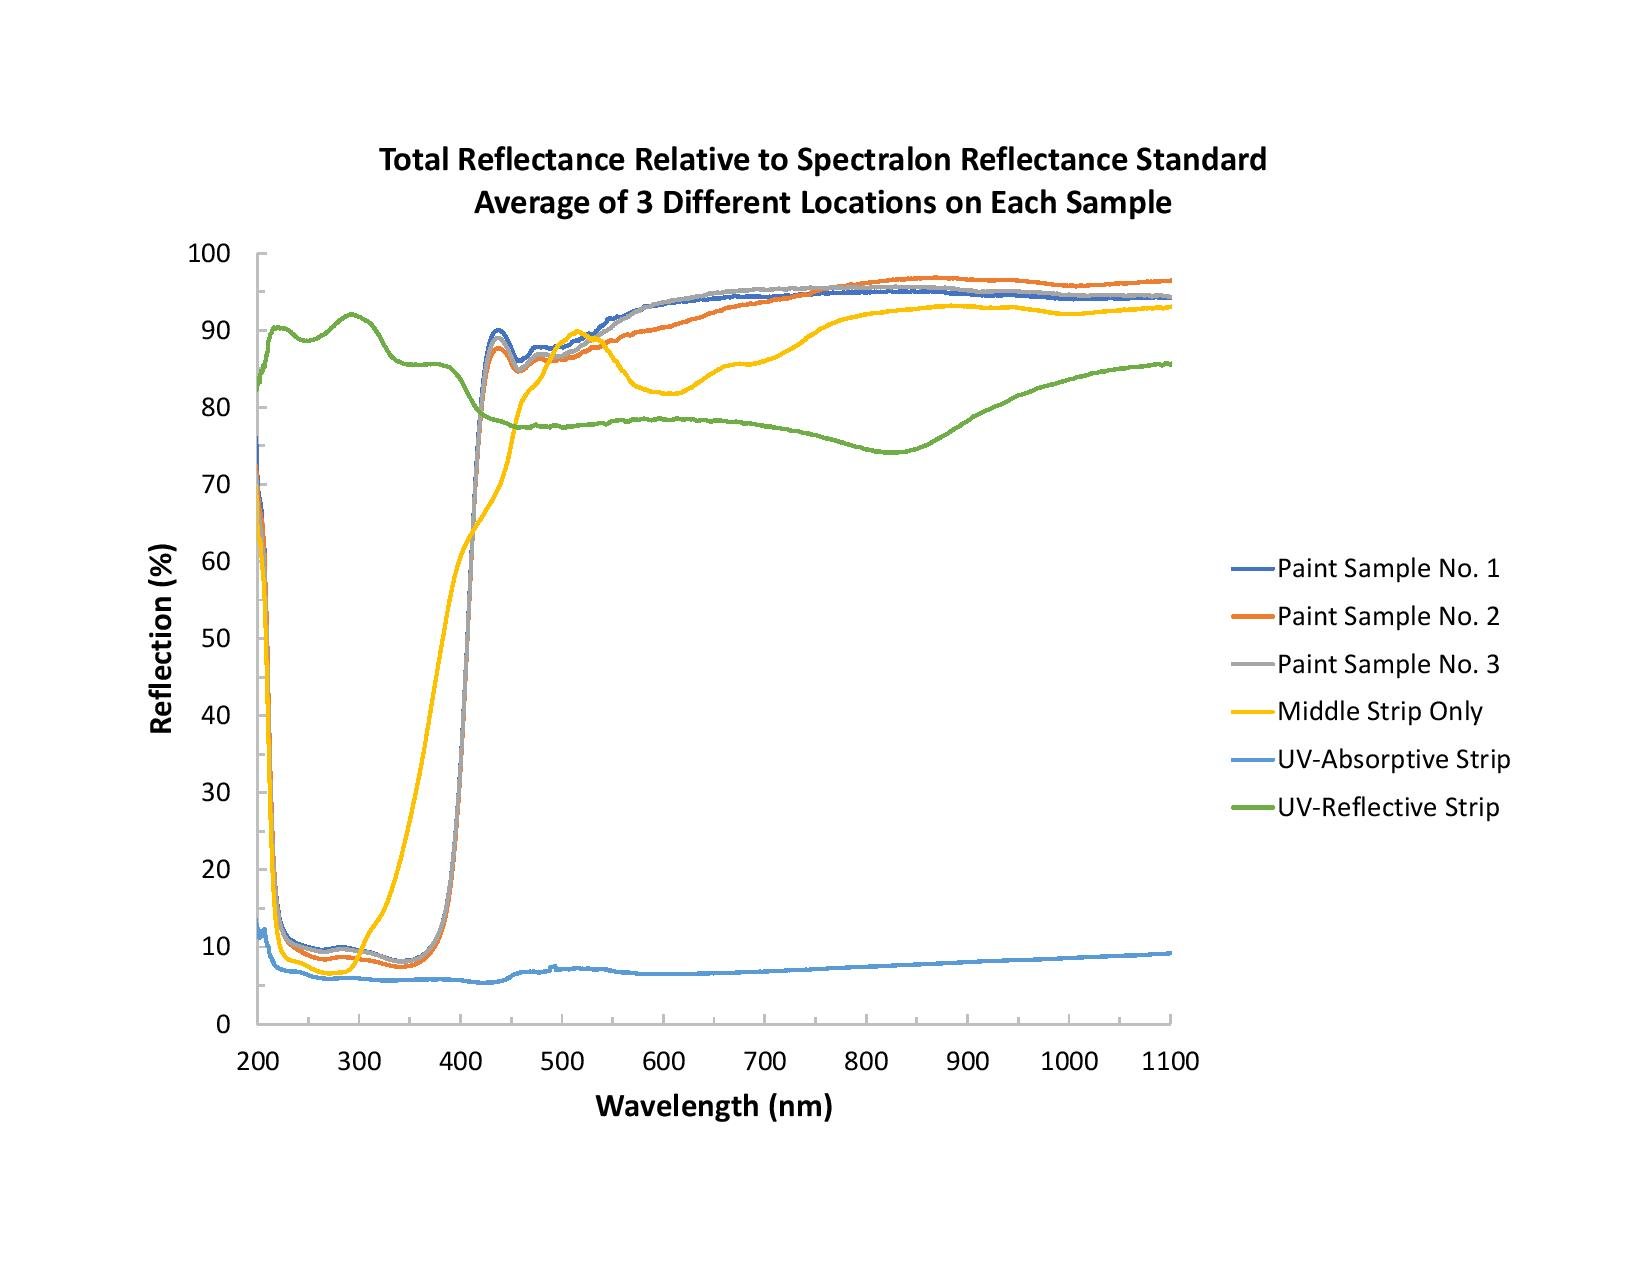
Figure 1. The total reflectance spectra here are the average of spectra measured at three locations in the middle strip of a flat surface. Data was also acquired for the paint applied to the areas above and below the middle strip. There may be some error in the reflectance data associated with a missing gloss trap piece for the integrating sphere, which we addressed by slightly modifying the accessory.
Why Paint Quality Matters
There’s a lot more to paint than how fast it dries or what a certain color will look like in your living room. For example, paint has additives designed to absorb UV wavelengths, helping to prevent fading and degradation, and even providing disinfection properties. With a broadband spectral system helping paint researchers to test new formulations more efficiently, manufacturers can produce higher quality, longer-lasting and safer paints.
-
Are These Sneakers Real or Fake?
Counterfeit goods cost businesses and consumers billions of dollars annually, with knock-offs increasingly difficult to identify. Spectroscopy can authenticate products by identifying embedded markers and substandard materials.
(more…) -
Reflectance of Coated Printed Circuit Boards (PCBs)

With some optical instruments, characterizing the reflectance properties of component coatings can be critical to ensuring optimal performance. In this application note, we measure PCBs painted with different black coatings.
(more…) -
Example Reflectance Measurement Setup
In this tech tip, we review the components you’ll need – spectrometer, light source, sampling optics — to make reflectance and color measurements. Configure components to optimize your setup for myriad applications.
(more…)